Branch Logs: PostgreSQL observability, right in the console
Read, filter, and search your PostgreSQL logs for any branch in the Xata console or the CLI. Per-branch, per-instance, no log drain to set up.
By:
Marcello NovelliPublished:
Reading time:
4 min readDebugging a database issue used to mean leaving the Xata console, SSHing into an instance, tailing a log file, and hoping the thing you were looking for hadn't already scrolled past. We thought we could do better.
Branch Logs is a log viewer built directly into the Xata web console. Filter, search, and inspect your PostgreSQL logs without touching a terminal.
Here's what's new:
Logs where you already are
Branch Logs lives in the branch dashboard, scoped to the branch you're looking at. Production and staging each have their own log view, so you're never accidentally staring at the wrong environment's errors wondering why nothing makes sense.
If your branch runs multiple instances, each one is labeled clearly: Primary, Replica 1, and so on. No cryptic instance IDs to decode.
Filter until you find the thing
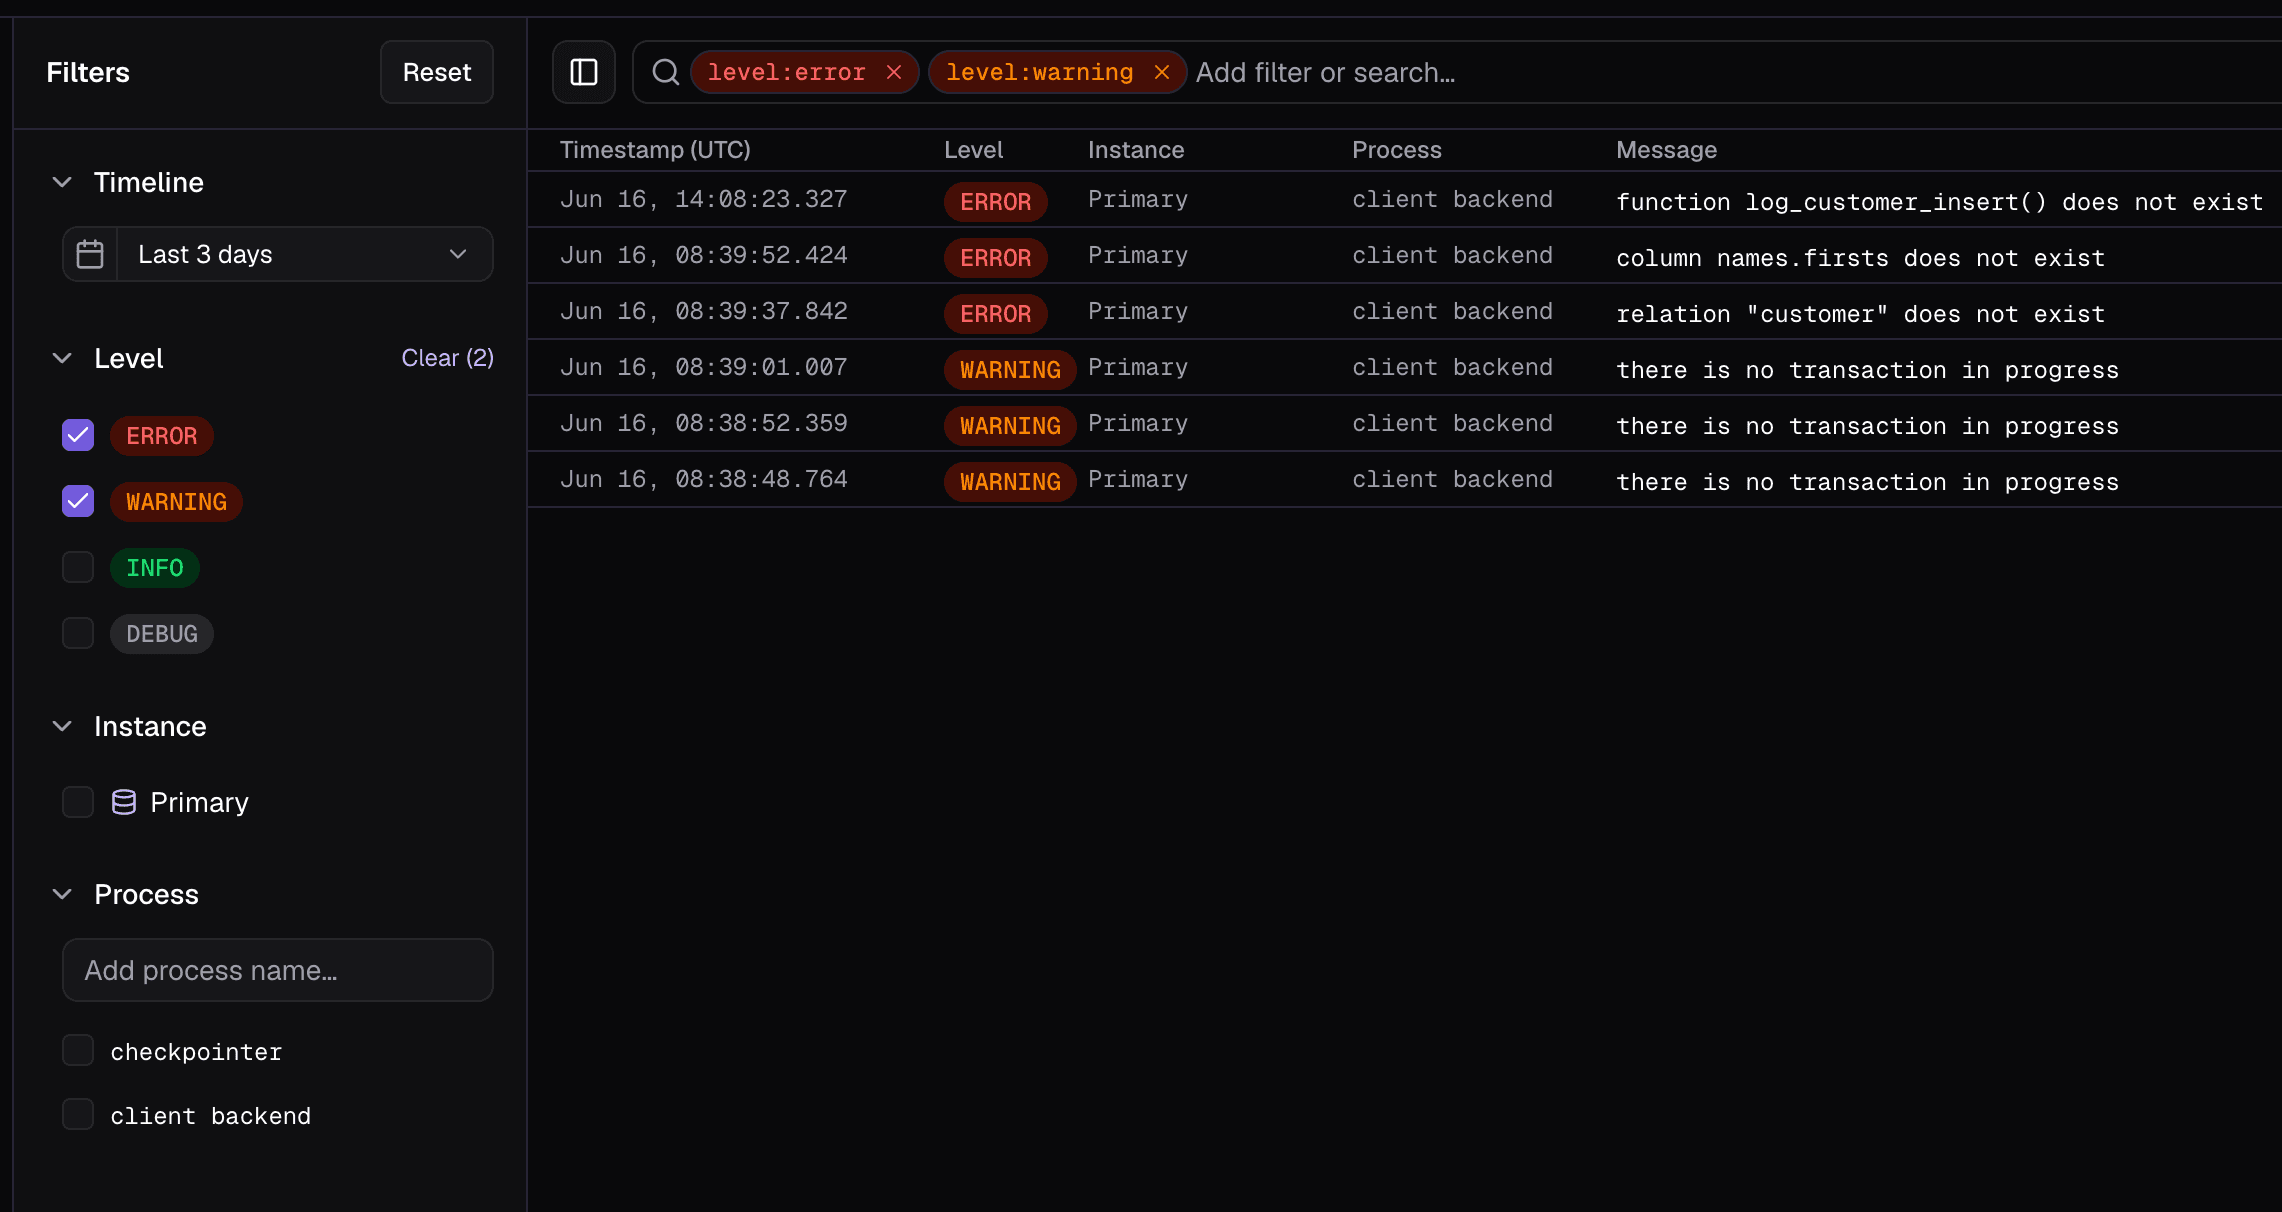
Four dimensions to narrow down logs: level (error, warning, info, debug), instance, process (the PostgreSQL subprocess), and message body. Filters appear as removable chips inline in the search bar, so you always see what's active at a glance.
Typing level: shows known values. Typing process: surfaces process names discovered from the logs you've already loaded. The search bar does the work of remembering what's available so you don't have to.
Message search supports plain text by default, and iregex for when you need it.
The whole thing is keyboard-driven: ⌘F to focus, Tab to complete a suggestion, Backspace to remove the last chip, and Escape to dismiss progressively without destroying anything you've typed. It closes the dropdown first, then clears the input, then blurs. Never nukes your work in one keystroke.
Time ranges that make sense
Eight presets cover the common cases: 1h, 3h, 6h, 12h, 24h, 3d, 7d, 30d. For everything else, there's a custom date and time picker with explicit start and end fields.
The interesting part is Slide to Now. When you refresh, the time window moves forward by however much time has passed, keeping the same duration. If you were looking at the last 3 hours, you still are. It doesn't snap to a new fixed range and leave you hunting for where you were.
The detail panel
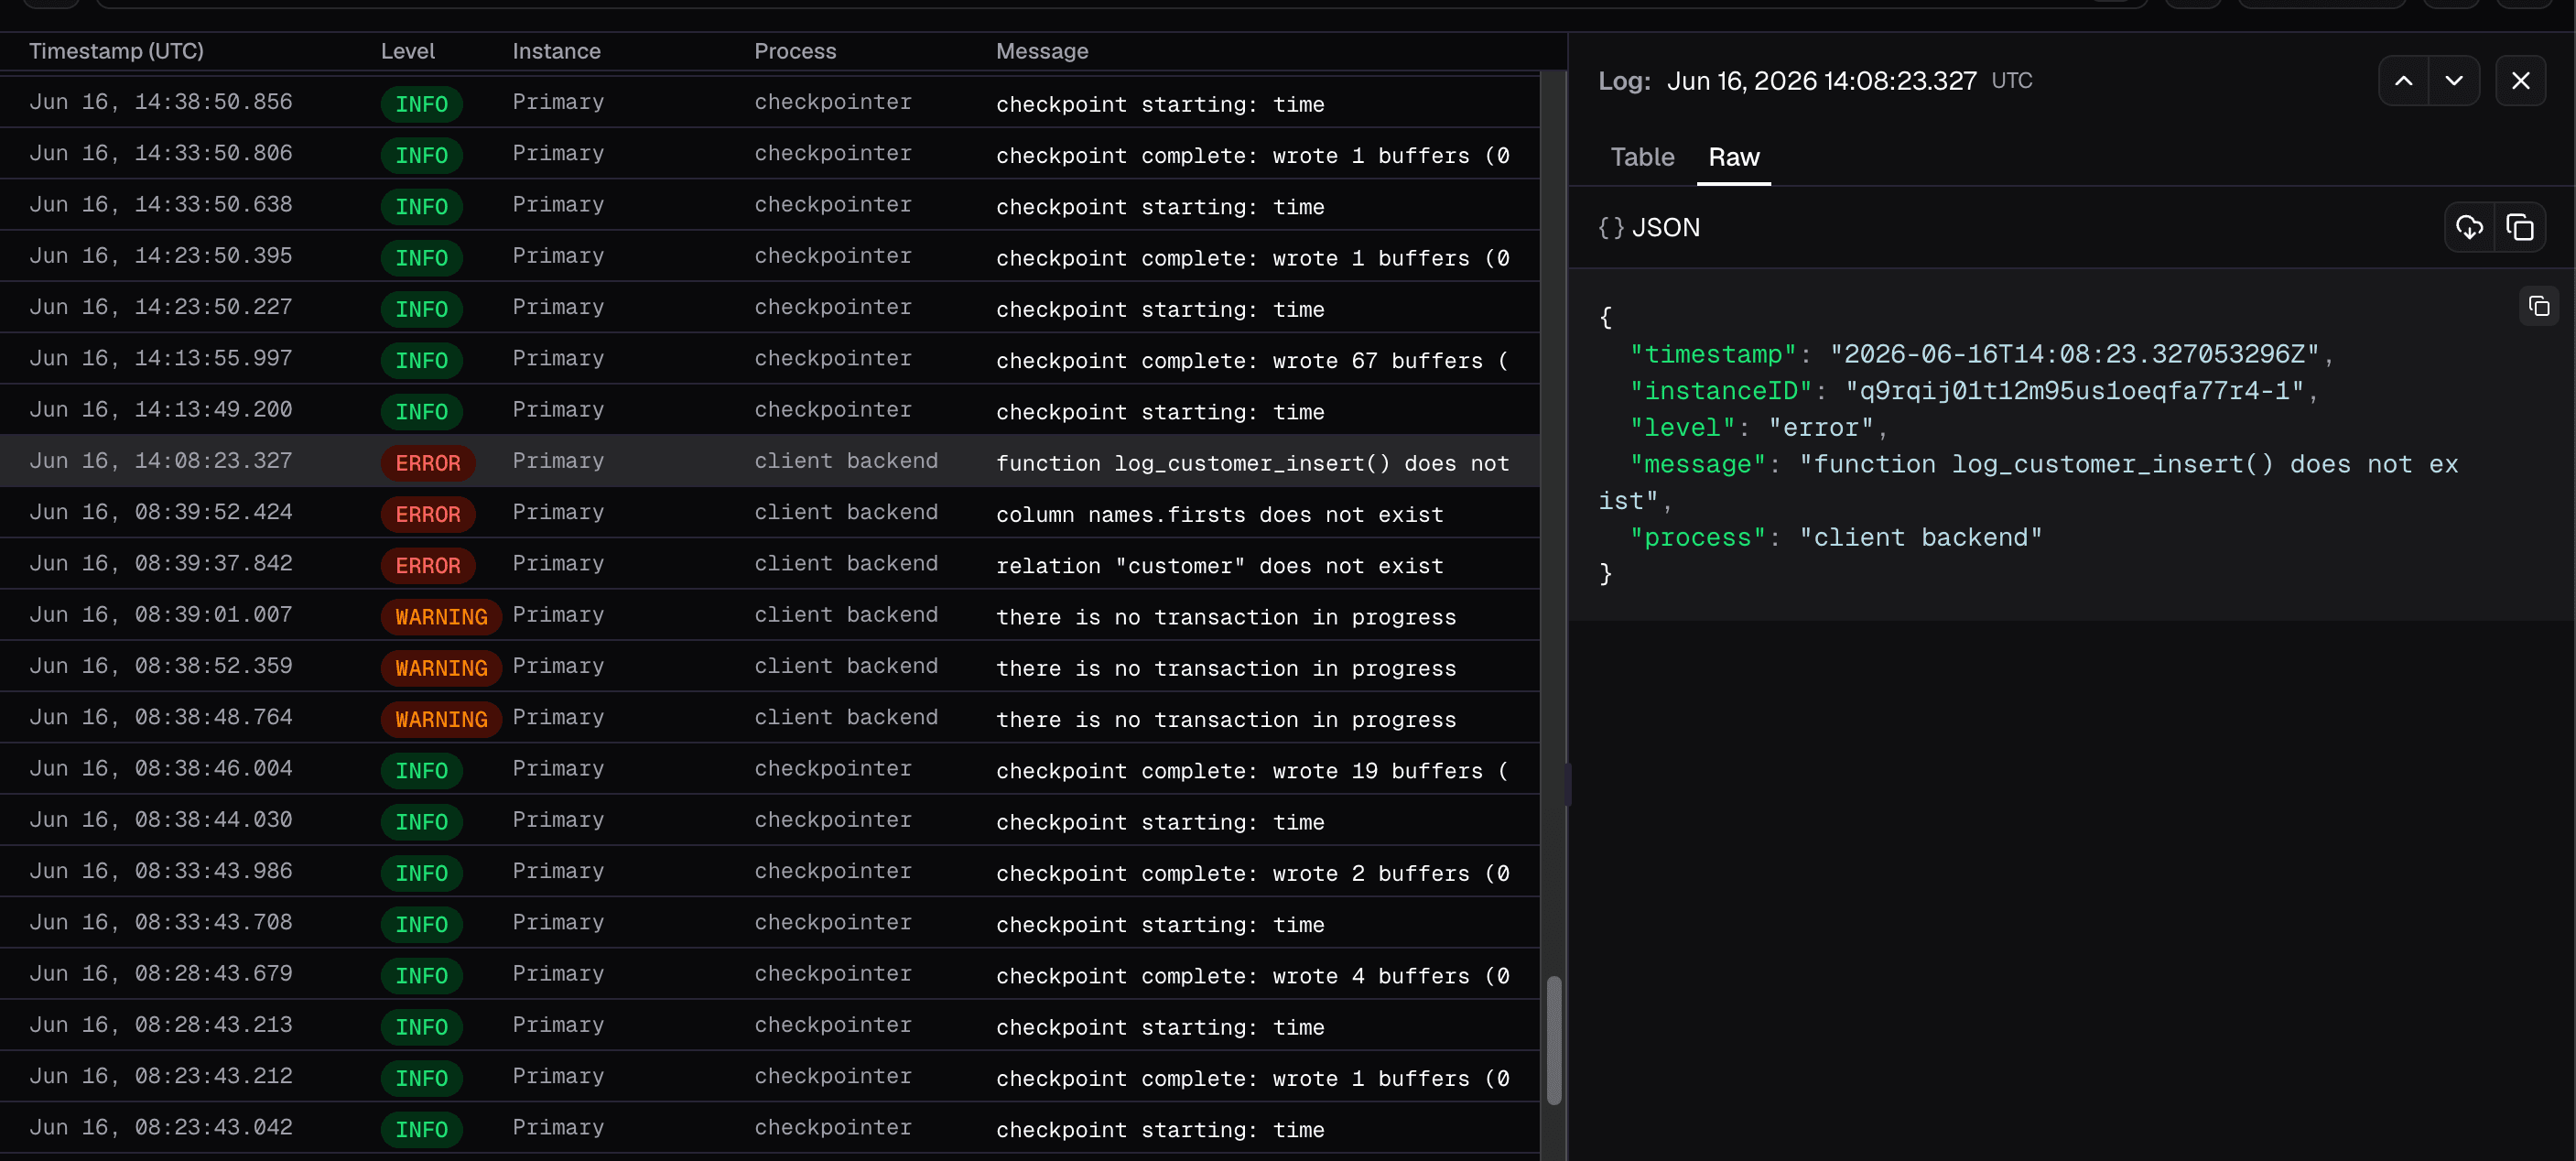
Click any row and a detail panel opens on the right with everything about that log entry. Two tabs: a human-readable table view with per-field copy buttons, and a raw JSON view with syntax highlighting.
Navigate between entries with Previous and Next inside the panel, no need to close it and click another row. The selected log is tracked by timestamp and instance ID, so if the list refreshes while the panel is open, it stays focused on the right entry.
Timezone control
Toggle between local browser time and UTC. The header shows the current offset (e.g. GMT-5:00) so there's no guessing. The preference persists across sessions, and every timestamp in the detail panel shows the timezone name. Timestamps in log debugging are already confusing enough without the UI making it worse.
Export
Download the current filtered view as JSON, CSV, or TXT. Or copy any individual row as JSON directly from the list. What you do with them after that is your business.
Keyboard shortcuts
Action | Shortcut |
|---|---|
Focus search |
|
Complete suggestion |
|
Remove last filter chip |
|
Dismiss progressively |
|
Branch Logs is available now in the Xata console, in the branch dashboard. Go find out what your database has been trying to tell you.
Prefer the terminal? There's a CLI for that
If you'd rather stay in your terminal, xata branch logs gives you the same data without opening a browser. Filter by level, instance, or process, search message bodies, set a time range with either ISO timestamps or relative durations like 1h or 7d, and output in raw, JSON, NDJSON, or CSV format.
The -f flag polls continuously for new logs, which is handy when you're watching a deployment and don't want to keep refreshing. For regex filtering, the --search flag handles plain substring matching — and for anything more complex, pipe --output raw into rg or grep and go from there.
Run xata branch logs --help for the full list of options.
More to come
This is part of a wider push to bring more observability tooling directly into Xata, so you can spend less time context-switching between tools and more time understanding what's actually happening. There's more on the way.
And as always, if something feels missing or a workflow feels off, let us know. We're building this for the people who have to read the logs at 2am.
Give every agentic workload its own Postgres branch
Create instant database clones with production-like data for every agent, workflow, and CI/CD pipeline.
Related Posts
How we rebuilt PostgreSQL branch metrics on VictoriaMetrics, per cell
How we rebuilt Xata's PostgreSQL branch metrics on a self-hosted VictoriaMetrics stack in six weeks, with zero user-visible downtime.
Are AI agents the future of observability?
After vibe coding, is vibe observability next?