How we rebuilt PostgreSQL branch metrics on VictoriaMetrics, per cell
How we rebuilt Xata's PostgreSQL branch metrics on a self-hosted VictoriaMetrics stack in six weeks, with zero user-visible downtime.
By:
Alexis RicoPublished:
Reading time:
6 min readEvery Xata branch is backed by real PostgreSQL. In the web console, each branch has a metrics view: CPU, memory, connections, disk I/O, network, WAL sync time, replication lag, database size. Support uses it to help customers. We internally read from the same shape of data to make capacity decisions. It has to be fast, cheap, and correct.
Over the last six weeks we rebuilt the pipeline behind that view. Metrics now flow through a per-cell stack built around VictoriaMetrics instead of through a single central observability vendor in our control plane. We've done the migration without any visible downtime from a customer’s point of view.
This is a long write-up of how we got there and what we changed along the way.
The starting picture
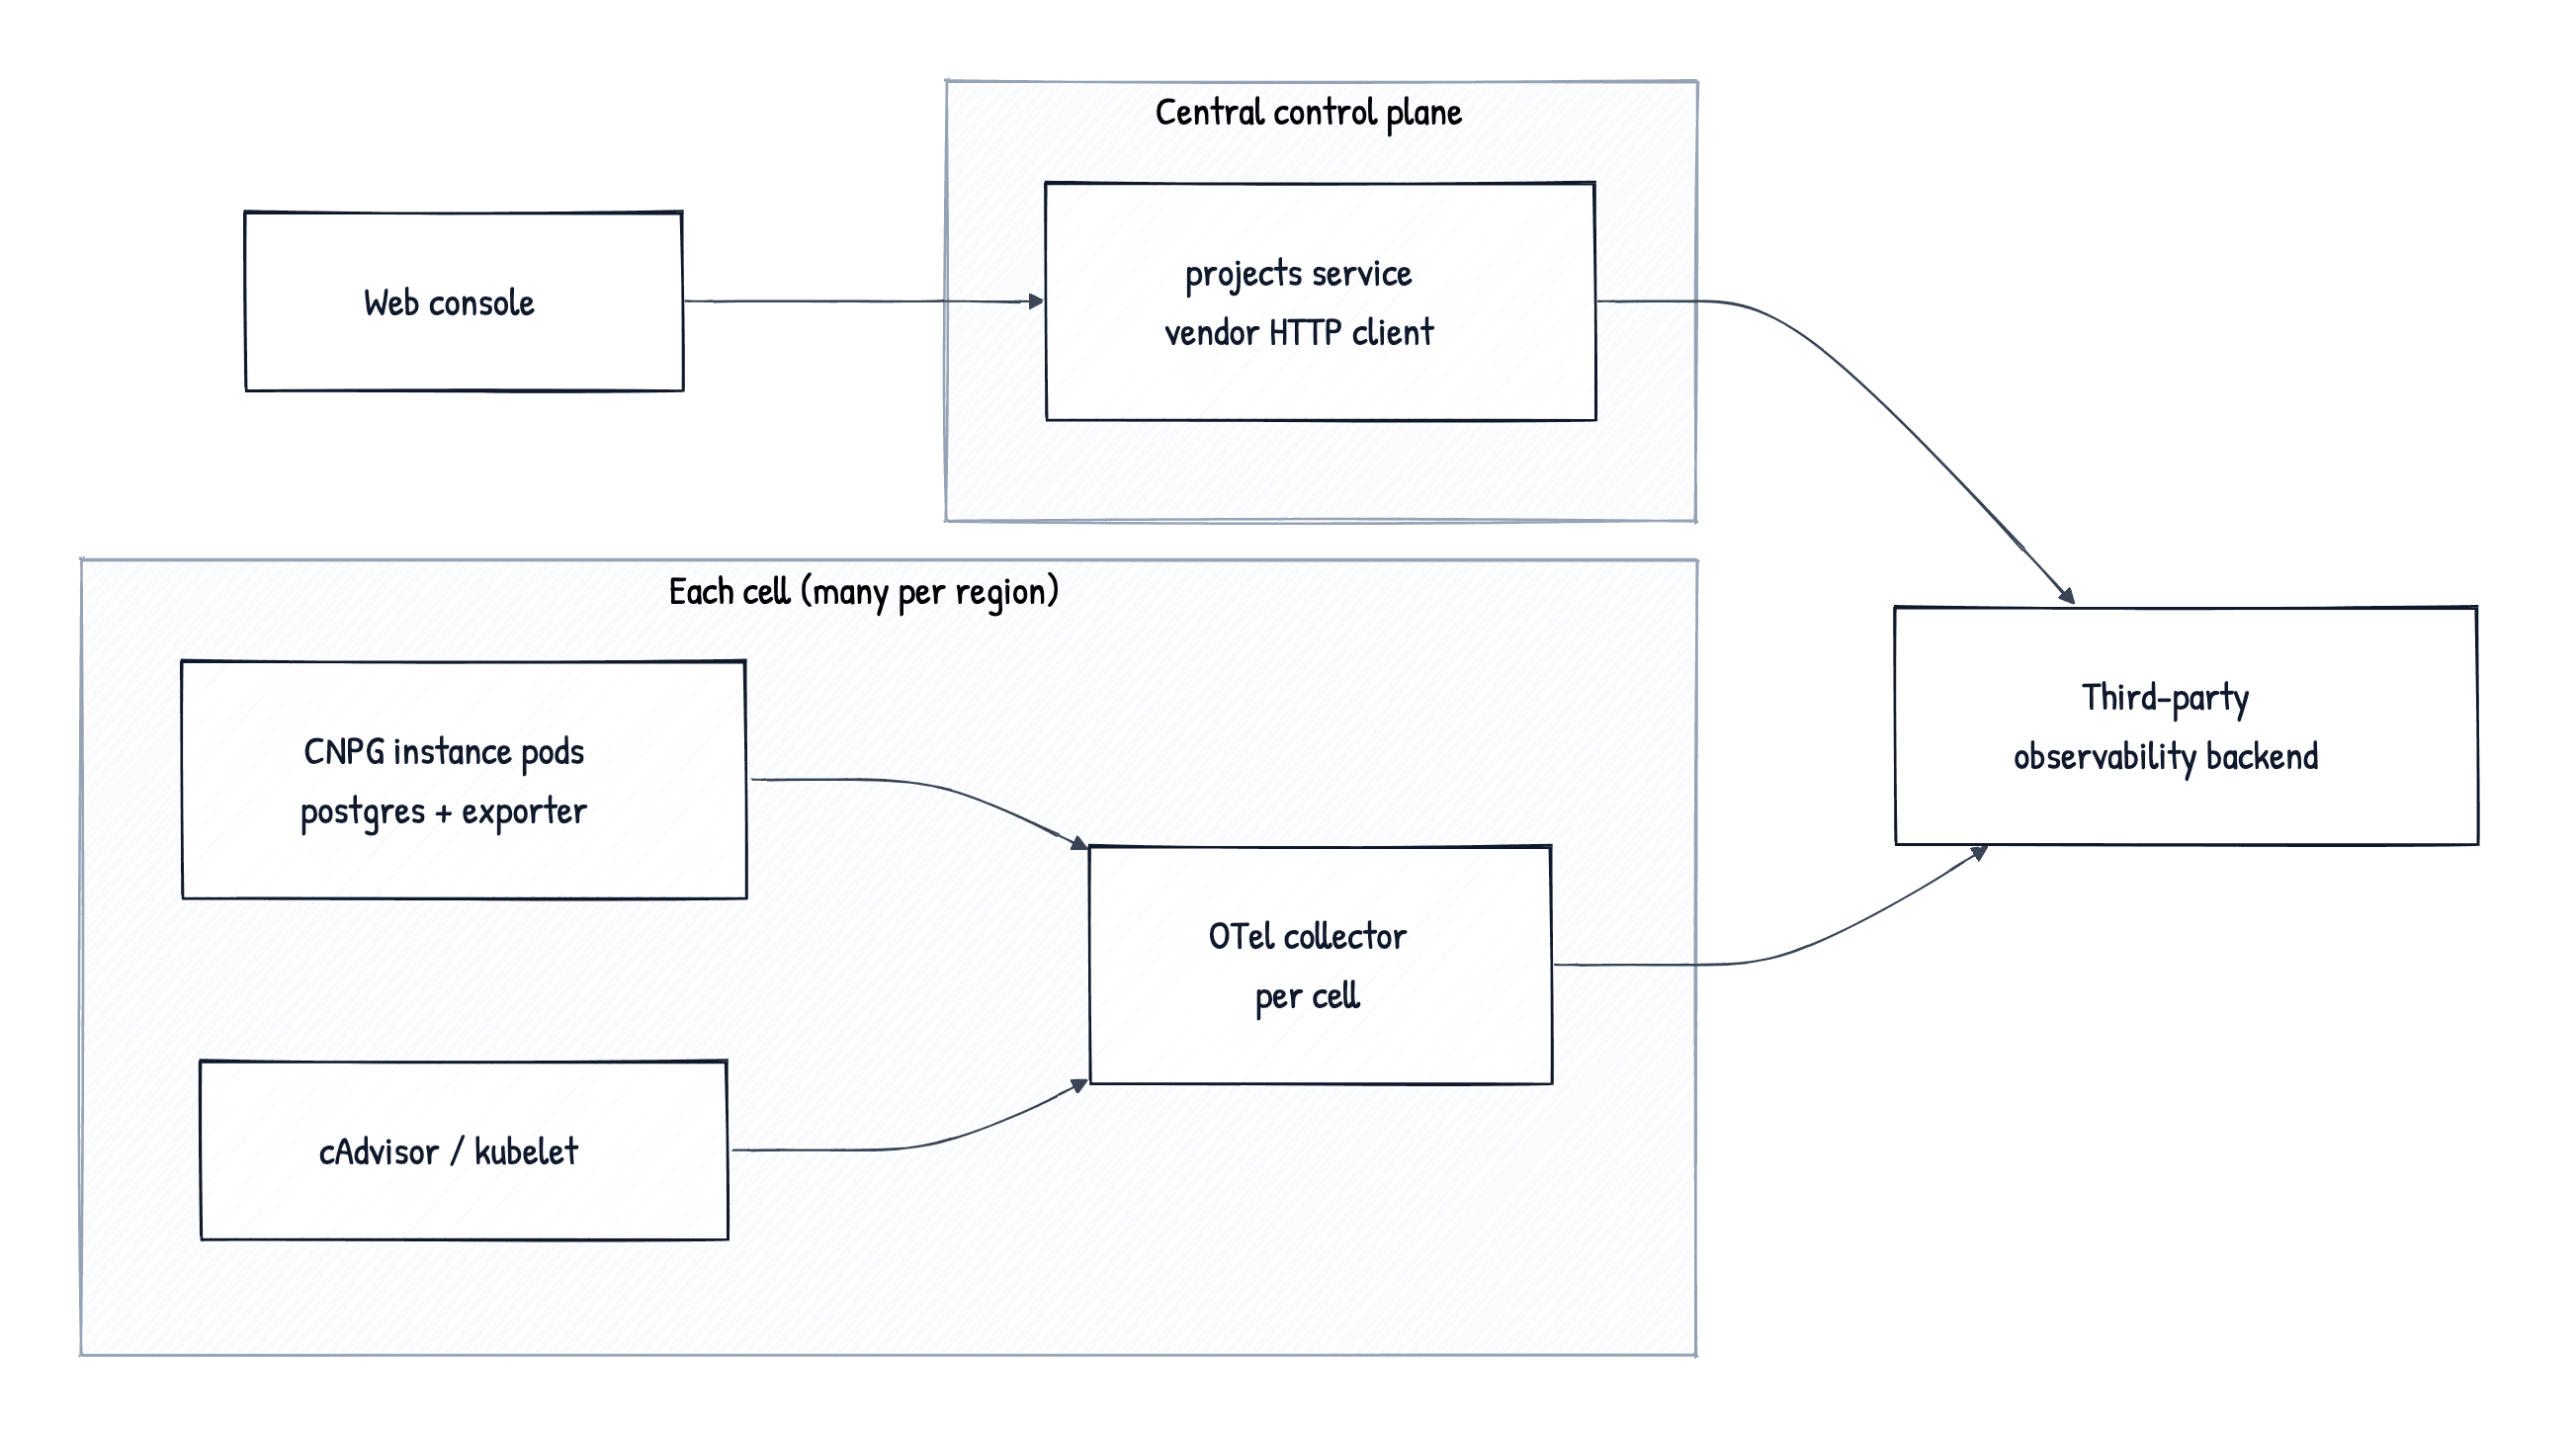
Xata is a multi-region service. In each of the regions, we have a "multi-cell" architecture, meaning multiple copies of our stack per region, depending on the scale.
Every cell in every region sent the collected metrics via OpenTelemetry to a hosted third-party observability storage. Inside one of our services, an HTTP client talked to the vendor's query API and shaped the response for the console.
It worked for a year. It was a good fit for a smaller fleet. Then we kept growing, and three things stopped lining up.
Why we moved
Scale
Branch metrics fanned in. Every Postgres pod in every region eventually sent data to the same external observability backend. That setup worked, but only up to the point where adding a new metric meant worrying first about how many new time series its labels would create.
We needed observability that lived next to the data, and a model that made bad labels expensive to write instead of expensive to query.
Performance
The metrics view in the console was slower than it had any reason to be. The page made one HTTP request per chart on every load, sequentially, because that's how the frontend codebase had grown over time. Each request went through a separate parse and plan on the vendor's API side.
A handful of small queries for one branch over one time window, where one query plan with a fan-out would have done. Additionally, our cloud observability vendor was starting to lag under the weight of everything being consolidated into a single store.
Cost
The bill from the vendor was growing on a curve that tracked branch creation. The cardinality story above was the biggest single driver.
We fixed it in our internal telemetry pipeline, and the projected drop on the residual surface is significant. But the lesson was the bigger takeaway. With one central store mediating every query, every accidental label becomes everyone's problem, and the only feedback channel is an invoice.
Why VictoriaMetrics
We did not go shopping for a new platform. We had a metrics product surface we needed to fix, and we wrote down what we needed before we picked tools.
- PromQL native. Our engineers already speak it. Our internal tools already know it. Adding a second query language for one product surface was a no.
- Cheap per active series. The cardinality bruise we just described made us label paranoid. VictoriaMetrics has a deserved reputation for being sparing with both memory and disk per active series.
- One binary per role. vmsingle, vmagent, and vlogs are each a statically linked Go binary with a small config surface. The platform team is small, and we don't like running things we can't reason about end to end.
- Per-cell deployable. Every Xata cell is already a self-contained Kubernetes cluster that has everything a customer's branch needs. Observability should live there too.
VictoriaMetrics fit each of those. We also rolled VictoriaLogs and Vector into the same chart, sized for the same per-cell footprint, because the foundation we wanted to build was bigger than the metrics view of today.
The new shape
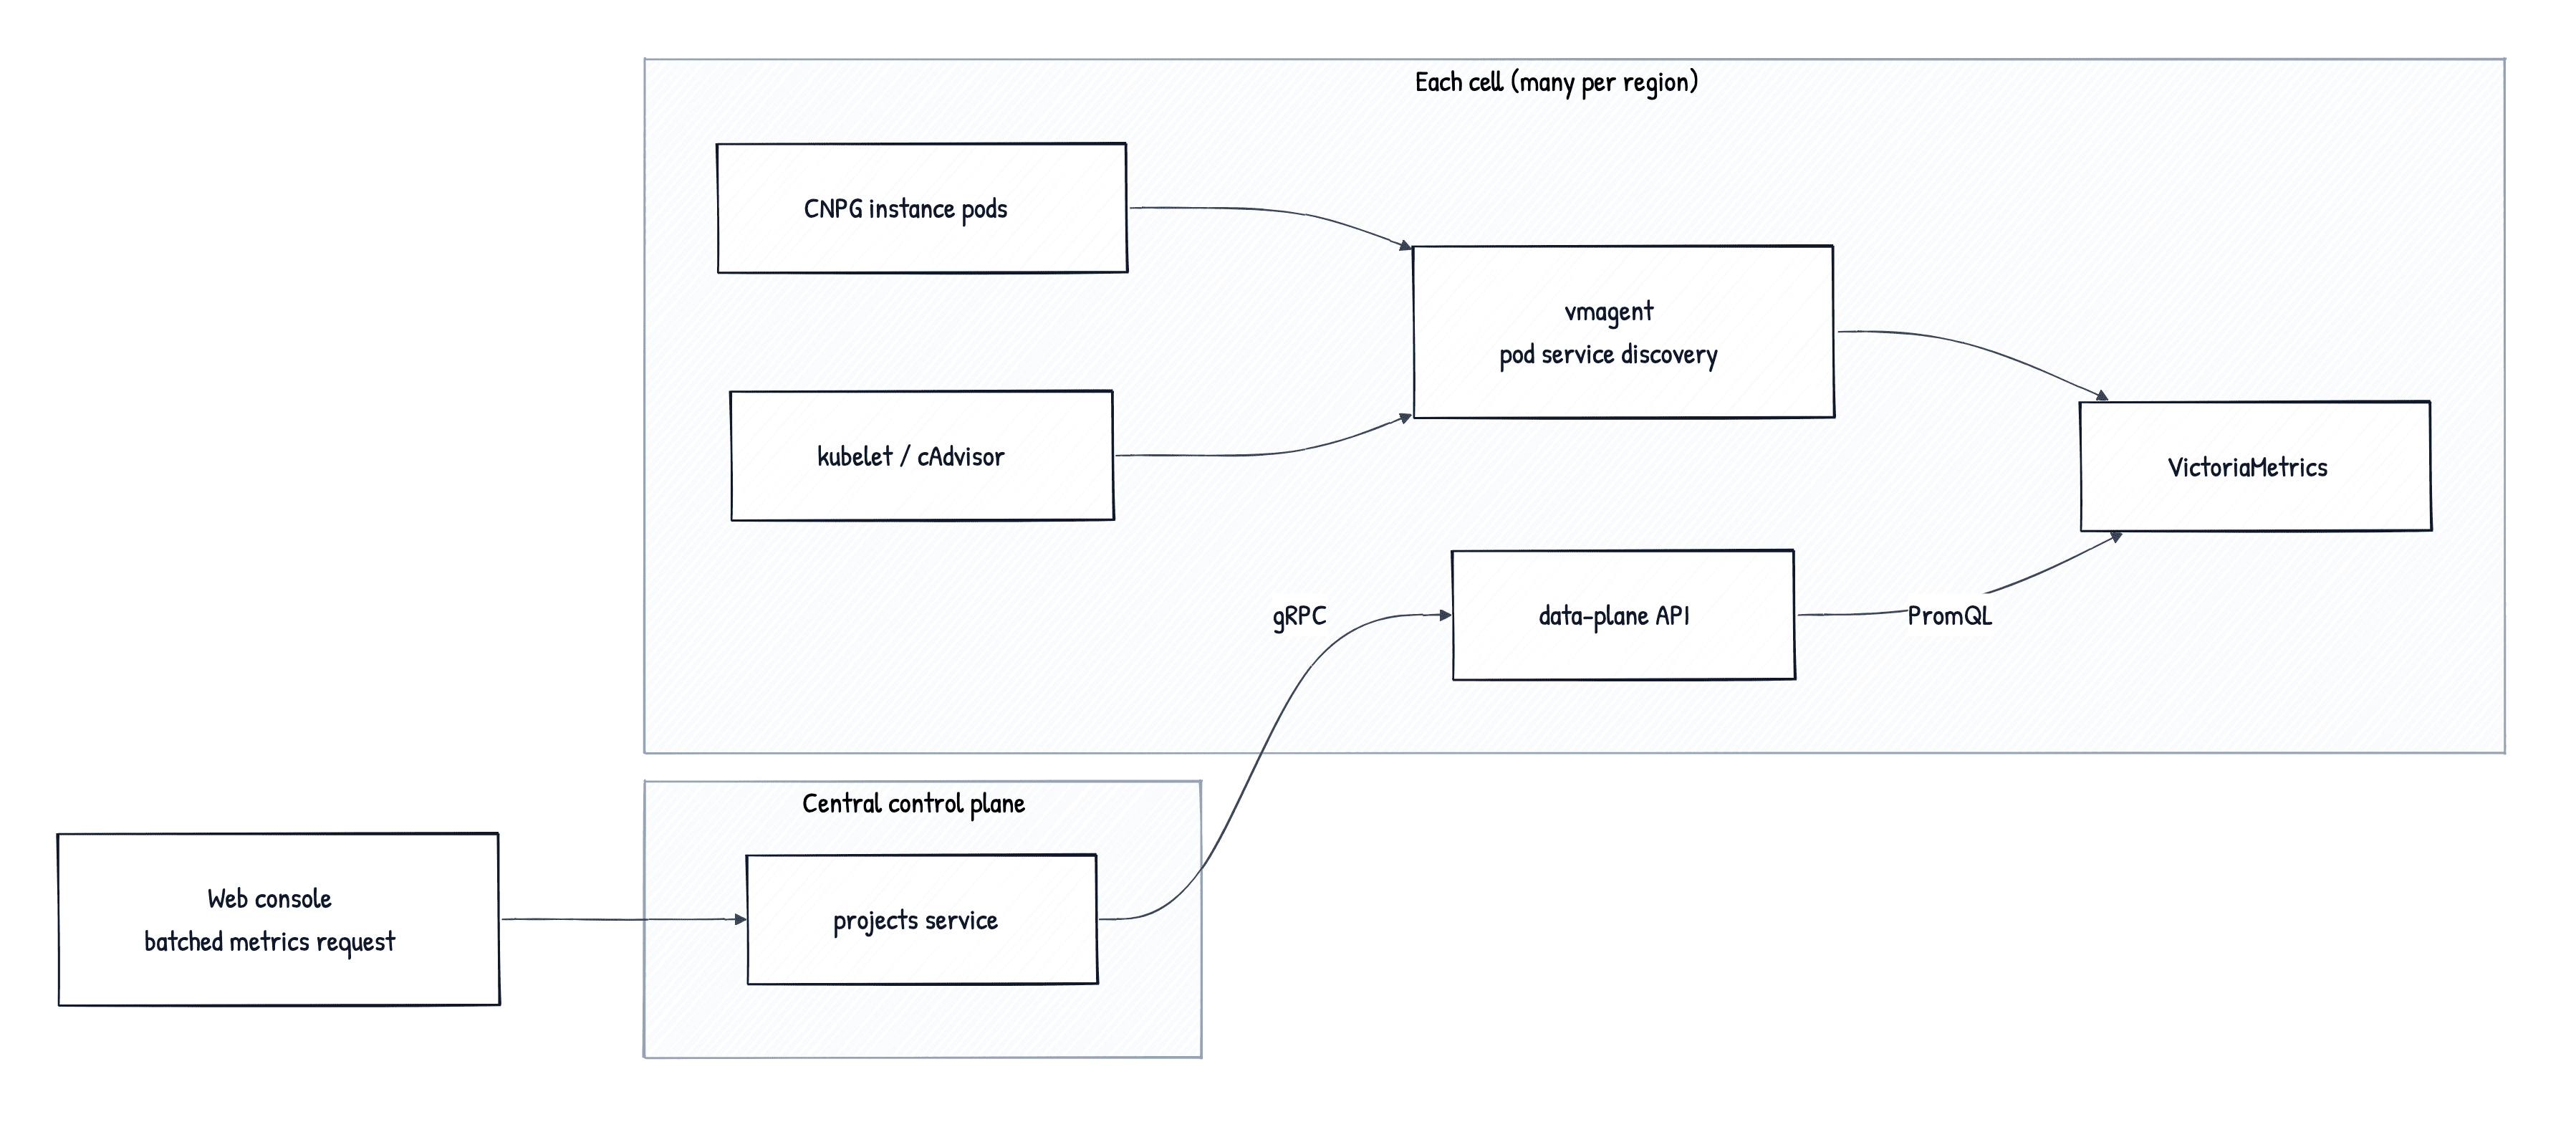
Two things to notice.
The store is per cell. Each cell runs its own vmsingle, its own vmagent, its own Vector DaemonSet. Nothing talks across cells. Cross-region OTLP is gone. One cell's observability can't take down another's.
The data plane owns the API. Reading a branch's metrics is now a gRPC call to the service that already manages CNPG inside the cell. The control plane no longer carries a hand-rolled HTTP client for a vendor query API. It makes one RPC, and the cell speaks PromQL to vmsingle locally.
The new client code is deliberately boring. VictoriaMetrics is PromQL verbatim, so there's nothing to translate. A thin wrapper around prometheus golang client is enough for the whole metrics surface. Logs go through a similarly thin wrapper around the VictoriaLogs HTTP API.
On the other side, we got to delete the old vendor client, the routing that used to switch between the two, the legacy config, the side-by-side selector, and the rollout feature flag.
The cutover
We treat a regression on a chart as a product regression. If the console says zero CPU on a branch that's being throttled, we lose trust we can't refund. So we built the rollout to keep the old backend live alongside the new one until the new one had earned the switch.
The waypoints, in order:
- Both backends in code, flag off. Both clients landed side by side in the data plane, behind a feature flag. Off everywhere by default. Nothing visible to users.
- Internal backend selector. A request header let our engineers choose the backend per request. The console exposed it as a dropdown for staff only, gated by the same flag. The team could pull up the same branch over the same window, side by side, and stare at the deltas.
- Alignment. Charts had to match. They didn't, at first. We were double counting until we constrained queries to per-container series and aggregated explicitly by pod, since cgroup pod aggregates were being summed with the per-container series. A few days later, every chart agreed to rounding.
- Auto routing by time range. The new store had to earn its retention window before it could serve old queries. We added a backend selector based on the request's start timestamp. Anything in the new retention window went to Victoria. Anything older went to legacy. The console didn't have to know.
- Auto by default. The flag flipped from "off by default" to "always on, override available". Inside the window, Victoria served the console. Outside, legacy did.
- Delete. Once the retention window covered every realistic chart query, we ripped out the legacy client, the routing, the override header, the flag, the config keys, and the per-cluster setup job. Net diff in the data plane was significantly negative.
Batched fetch
While the backend was being rewritten, the frontend was making one HTTP call per chart on every page load. Independent on the wire, sequential because of how the data hooks were composed.
We rewrote the data hook around a single batched endpoint that returns every chart in one response, and added per-chart refresh on top. The page feels noticeably snappier. The bigger win is on the other side: one PromQL fan-out inside vmsingle instead of many separate parses and plans.
What stuck with us
A few things that are easy to miss in the diff:
- The vendor client was a large block of HTTP code against a proprietary query API. The Victoria equivalent is a thin wrapper around an off-the-shelf Prometheus client. When the abstraction matches the system, the code shrinks.
- The query layer lives next to the storage. A query for a branch in one cell never leaves that cell. The blast radius of any single observability outage is one cell.
- The cutover was reversible at every step until the last one. During alignment we flipped headers and compared charts in real time. There was no point where we couldn't roll back.
- The feature flag, the selector, the override header, and the side-by-side UI were all deleted within a week of being switched off. We have a small but firm rule that scaffolding gets removed once it's not load bearing.
- The charts kept rendering the whole way through.
What's next
The foundation we put down in each cell is intentionally larger than the metrics view of today. VictoriaLogs and Vector are deployed in every cell, exercised by internal use, and sized for the path ahead. We'll have more to say about that soon.
For now, branch metrics in the Xata console are served by VictoriaMetrics, per cell, with the data they describe living one Kubernetes namespace away from the store. We're happy with that.
Give every agentic workload its own Postgres branch
Create instant database clones with production-like data for every agent, workflow, and CI/CD pipeline.
Related Posts
Are AI agents the future of observability?
After vibe coding, is vibe observability next?
Inside Xatastor: ZFS + NVMe-oF for millions of Postgres databases
Read the technical details of our new distributed storage system, which is the key to scaling to a huge number of Postgres instances.