Are AI agents the future of observability?
After vibe coding, is vibe observability next?
By:
Tudor GolubencoPublished:
Reading time:
9 min readSince releasing the Xata Agent, our Postgres AI expert, one of the most common questions we’ve got is a variation of:
I’m currently using \{Datadog|Grafana|Elastic\} for monitoring Postgres, how is this tool different?
We usually answer this in terms of what the Xata Agent already does today for Postgres, but I think the question gets even more interesting if we generalize this to: What can LLMs bring to the observability space?
The standard way SRE and software teams keep their services up and healthy looks something like this:
- Collect heaps of metrics, logs, and traces (the famous three pillars of observability).
- Set up monitors with warning and alert thresholds. Sometimes combined with ML-based anomaly detection.
- Define on-call schedules for 24/7 coverage. If a monitor hits the alert threshold, an on-call engineer gets paged.
- Create dashboards in a visualization tool to quickly review many related metrics at once and notice correlations.
- Use playbooks, table-top exercises, chaos testing, postmortems, incident management tools to improve the confidence of the on-call engineers.
- Define, communicate, and measure your service objectives and agreements (SLO, SLA) in order to guide alert thresholds and give engineers some leeway.
I’d say this has been the standard for the past 10 years or so. An enormous amount of blog posts, conference talks, and podcasts have been created on the topic of best practices for each of the points above. And it works: you no longer need to be Google in order serve Google-level traffic with Google-level SLAs. In fact, you probably only need a handful of excellent SRE/platform engineers. At least partially, this is thanks to very good observability tools and best practices.
However, I think the current observability tooling is in a local maximum, and AI agents might be the way to escape it.
Let’s look at the main pain points:
- Weekend/night on-call is the most stressful duty an engineer has.
- Observability tools are expensive, often the single biggest spend outside of the core infra.
- SRE and platform engineers are among the hardest to hire and the most prone to burnout.
The next sections look at each of the above to see if AI-first observability can change the game.
Relieving on-call
Think about how you are doing on-call today. If your process is similar to ours, it will look something like this:
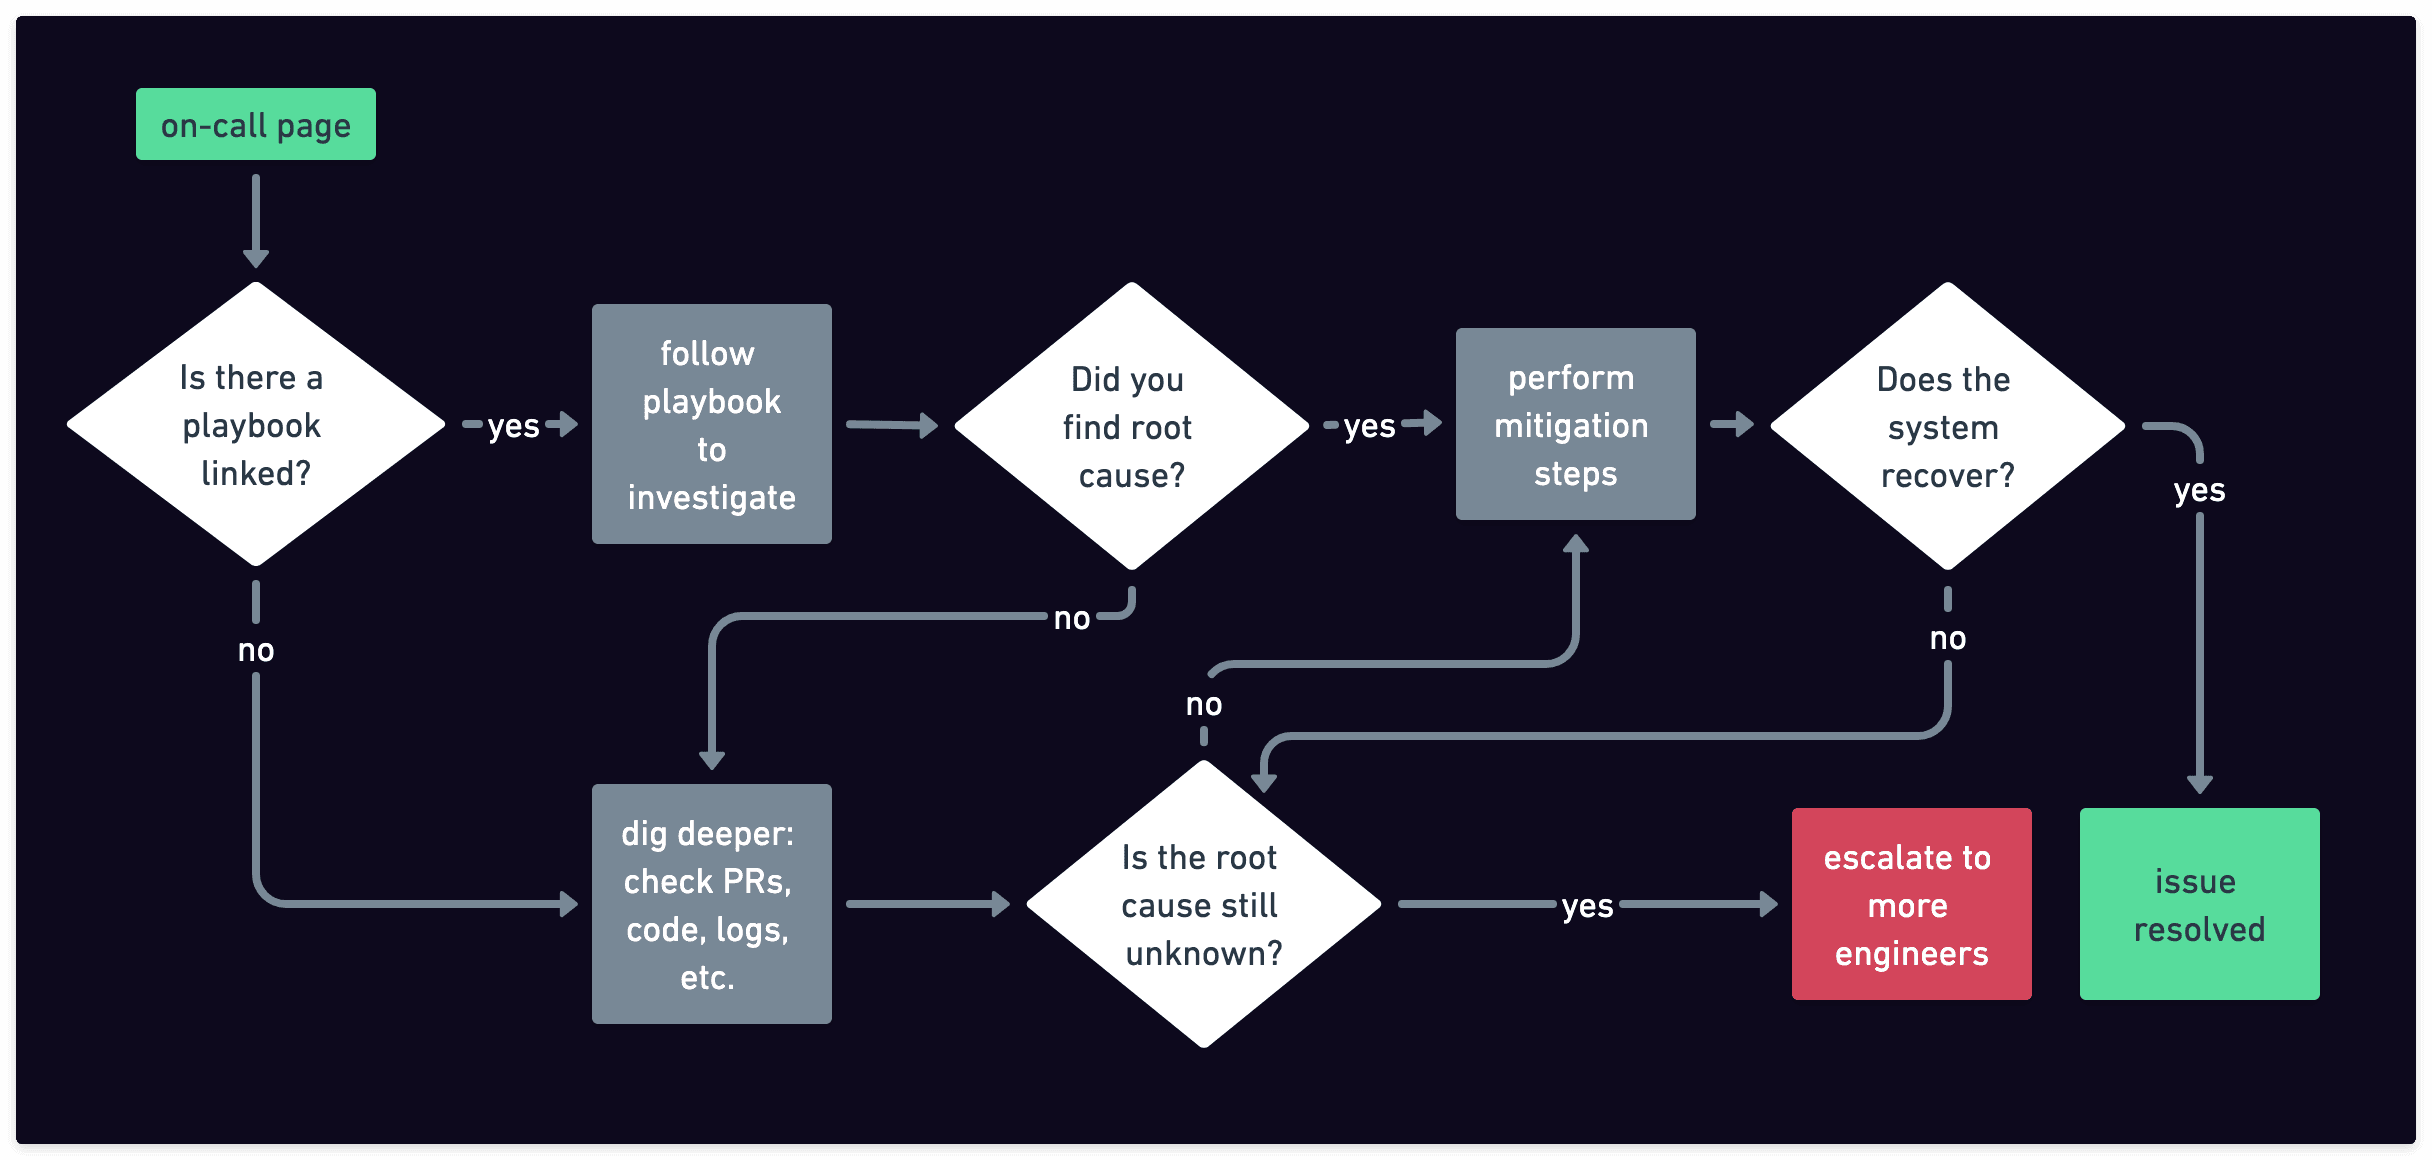
Typical On-Call Experience
- An observability tool raises alerts based on metrics (usually) or logs/traces (occasionally). If the alert hits at night, the tool wakes you, the person on-call, up.
- If you’re lucky, the alert links to a playbook your team already wrote on how to troubleshoot it.
- The playbook might point to specific dashboards and metrics to check for correlations. You eyeball the graphs, using your two very human eyes.
- If the situation seems to be similar to one that has happened before, the playbook might already give you instructions on how to resolve, or at least mitigate, the issue.
- In something like 42.9% of the cases (I made the number up), the action to take is “no action”. The system just recovers on its own after, for example, the increase in traffic that has caused the alert has passed. This makes you question whether you needed to wake up at 3 a.m. for a ghost alert. Again.
- If you're not lucky—no playbook, or the playbook doesn’t match the situation—you’ll probably need to: check recent PRs for likely culprits, fire up your IDE to reason through the code, grep through logs, etc.
- If you still haven’t figured it out, you escalate and wake more people, usually the engineers most familiar with the affected service or code.
How can an AI agent help?
First of all, it can be on-call 24/7, with humans only as an escalation option.
Then, it can investigate the root-cause:
- Using playbooks that are written by the team ahead of time.
- Checking previous incidents documented in the internal knowledge base.
- Looking at the code in GitHub and by checking the recent commits/PRs.
If there is no playbook for the particular alert, it can use its own internal knowledge to generate one, and then execute it. During this process, it can search the web, check status pages of dependency services, or check the documentation of the systems involved.
If it successfully identifies the cause, in that ~42.9% of cases where the system self-recovers, it can recognize this and simply continue monitoring to confirm recovery.
If the necessary action is low-risk (e.g., scaling up a component), it can take that step without waking anyone up.
If confidence in the root cause is low, or the recommended action is risky (e.g., adding a new index), the agent will page a human. But this time, the engineer wakes up to an already written summary: what’s happening, the likely root cause, and suggested next steps. The agent has already done half the work.
Finally, the agent now has all the information to write the incident report and also store it in its knowledge base, in case it happens again.
Reducing $$$ cost
If you’ve worked with Datadog or Splunk, you know these tools get expensive quickly. Open-source alternatives are cheaper, but really only by comparison. The truth is, there are good reasons observability tooling is expensive:
- Data hoarding: we collect as much data as we possibly can, because we don’t know what will prove useful during an incident. We also index all this data (which is expensive in CPU time), so we can have fast dashboards.
- Centralization: it’s very tempting to have a single tool to do metrics, logs, traces, alerting, on-call schedules, synthetic tests, real user monitoring (RUM), and more. Several vendors offer all of this. But this bundling makes pricing opaque and nearly impossible to estimate before committing.
- Development & operational costs: Creating a really good observability product is genuinely hard. I know, because I worked on several. You need experts in every monitored technology, plus UI/UX talent, and often custom databases with experts to run them. Building and running your own based on open-source tools is still a bit effort, and investing time in that means you don’t invest in your core product.
Can the LLM-based AI agents change the game from a cost perspective? Maybe. I imagine a system like this:
- You use OpenTelemetry to collect metrics/logs/traces. You send them as raw data to S3 where they are kept “just in case” and for compliance.
- The AI agent has tools to retrieve data directly from the source (e.g., Kubernetes or your cloud provider), but it can also fetch historical data from S3 when needed. This gives it both real-time awareness and historical context.
- The AI agent UI can display graphs and visualizations client-side, showing only what’s relevant. That means you don’t need to maintain dashboards as much, because the agent can create them on the fly. When you do want traditional dashboards, tools like DuckDB can work with the raw data in S3.
- Since the data is not centralized and pre-indexed, aggregating and visualizing it is slower, but the AI agents are more patient than we are. And they are more selective in what data they really need to check.
The Xata Agent, for example, retrieves the Postgres metrics and logs directly from the Postgres service (e.g. for RDS via Cloudwatch). It doesn’t need to store them again in its own storage. On a typical run, it checks first the high level metrics like CPU, memory, and latency. It drills down to retrieving other metrics and logs only when it detects something worth investigating.
SRE expertise
SREs and platform engineers these days are expected to be experts in a growing number of technologies, including cloud services, IaC, Kubernetes, and multiple database technologies. On top of that, they need to have excellent communication and prioritization skills simply to justify their own job to upper management. No wonder they’re so hard to hire.
For example, the reason we hardly see any DBA jobs today is because those responsibilities have largely fell on SRE and platform teams. But a typical SRE doesn’t have the depth of knowledge in Postgres that a Postgres DBA once had. Instead, they tend to read the docs “on demand” when something breaks, or ask for help on mailing lists, Discord, etc.
Now imagine that AI agents, in addition to their built-in general knowledge, can be equipped with tools and playbooks from top experts in each technology.
That’s already the case for the Xata Agent, which we’re battle-training to troubleshoot issues across tens of thousands of active Postgres databases every day. With every incident, we improve an existing playbook or add a new tool. A few of these tools and playbooks are specific to how we do things at Xata, but many are applicable to any Postgres installation.
That means we are growing a community library of tools and playbooks. It is released as Apache-license open source and we’re hoping others will contribute their own tools and playbooks too.
There is another way to think about playbooks, which is inspired by a skeet by Simon Willison. SREs can basically build their own custom software to help them operate the infrastructure. They write this software in plain English, by telling the agent which tools to run, and under which conditions.
Challenges and next steps
The blog post so far presents a one-sided story, but let’s look at some counter arguments as well. These are all valid objections that we heard about the Xata Agent already.
Privacy: What are the risks of sending data about your production environment to third-party LLM providers like OpenAI, Anthropic, Deepseek, etc? Even if the Xata Agent is open-source and fully self-hosted, it does rely on online LLM APIs. It doesn’t send your actual database data, but it may include metadata like table or column names, metrics, error logs, and so on as part of the prompts.
If this is a major blocker, probably the best solution today is to invest in self-hosted LLMs. The good news, in my opinion, is that LLMs are generalists, so if you have a local LLM for your code tools, you can use it for observability as well.
LLM cost: Isn’t calling models expensive? Are we replacing the high cost of observability tools for the high cost of AI APIs?
From what we’ve seen running the Xata Agent so far, the cost of current LLMs is still much smaller (like 2 orders of magnitude) compared to what we pay our observability solution. And this is with the most expensive models from OpenAI and Anthropic.
This one might go both ways in the future, but I’m somewhat optimistic that it won’t be a major bottleneck.
Hallucinations: What if the AI agent takes down production? What if it deletes data? What if it does something illegal?
For the time being, I think it’s important to limit what AI agents can do without supervision. This limits their usefulness, but also prevents the worse case scenarios.
For example, the Xata Agent currently does not have a tool for running arbitrary SQL. We don’t want it YOLO’ing a TRUNCATE in production. Instead, it’s limited to predefined SQL actions: retrieving active queries, slow queries, current settings, active connections, etc.
We do want to add support for arbitrary SQL execution, but only behind an approval workflow. Until then, the Agent may recommend SQL for you to run, but it won’t run it itself. No YOLO mode (yet).
What’s coming next?
The space of AI agents for observability is just getting started. A number of startups are promising AI-based RCA, alert triaging, or on-call assistance. Most are either generic or focused on Kubernetes. Examples are Deductive.ai, AgentSRE, Parity, Cleric. In the Postgres space, besides our own Xata Agent, I’m aware of two others in development: dba.ai by Tembo, and CrystalDBA.
I believe the rise of MCP servers (every SaaS and their dog is getting one) will accelerate these agents faster than what you’d expect. MCP also means that some of these agents will collaborate with each other. For example, one agent specializing in Kubernetes collaborates with another focused on Postgres to resolve a complex incident.
I’m awfully biased, but I think the approach we take with the Xata Agent has the key elements to tackle the challenges above:
- Open-source and transparent with what tools, playbooks, and prompts are used and how.
- Focused on a specific area where the team has deep expertise (PostgreSQL).
- MCP-native both in calling tools from other services and offering its functionality to other agents.
If you are interested in what AI agents could mean for observability, we’d love it if you would give Xata Agent a try and maybe even contribute to it. If you’d like to learn more about it, don’t hesitate to reach out to us.
Give every agentic workload its own Postgres branch
Create instant database clones with production-like data for every agent, workflow, and CI/CD pipeline.
Related Posts
Xata Agent v0.2.0: Powered-up chat, custom playbooks, GCP support & more
Version 0.2.0 introduces a redesigned chat interface, customizable playbooks, support for monitoring PostgreSQL instances on Google Cloud Platform and various improvements across the board.