We skipped the OLAP stack and built our data warehouse in vanilla Postgres
Skip the OLAP stack. See how we built a product analytics warehouse on vanilla Postgres with materialized views, pg_cron, and copy-on-write branches.
By:
Noémi VányiPublished:
Reading time:
9 min readWe centralized identity data, product usage, billing, and PostHog events into a Postgres data warehouse using materialized views, pg_cron, and database branches without dedicated OLAP system.
At Xata, we’re a small team building a Postgres service, so adding a complex analytics stack didn’t make much sense. Instead of expensive OLAP systems, we built our product analytics warehouse on vanilla Postgres. It gives us the visibility we need to improve onboarding, activation, and product decisions.
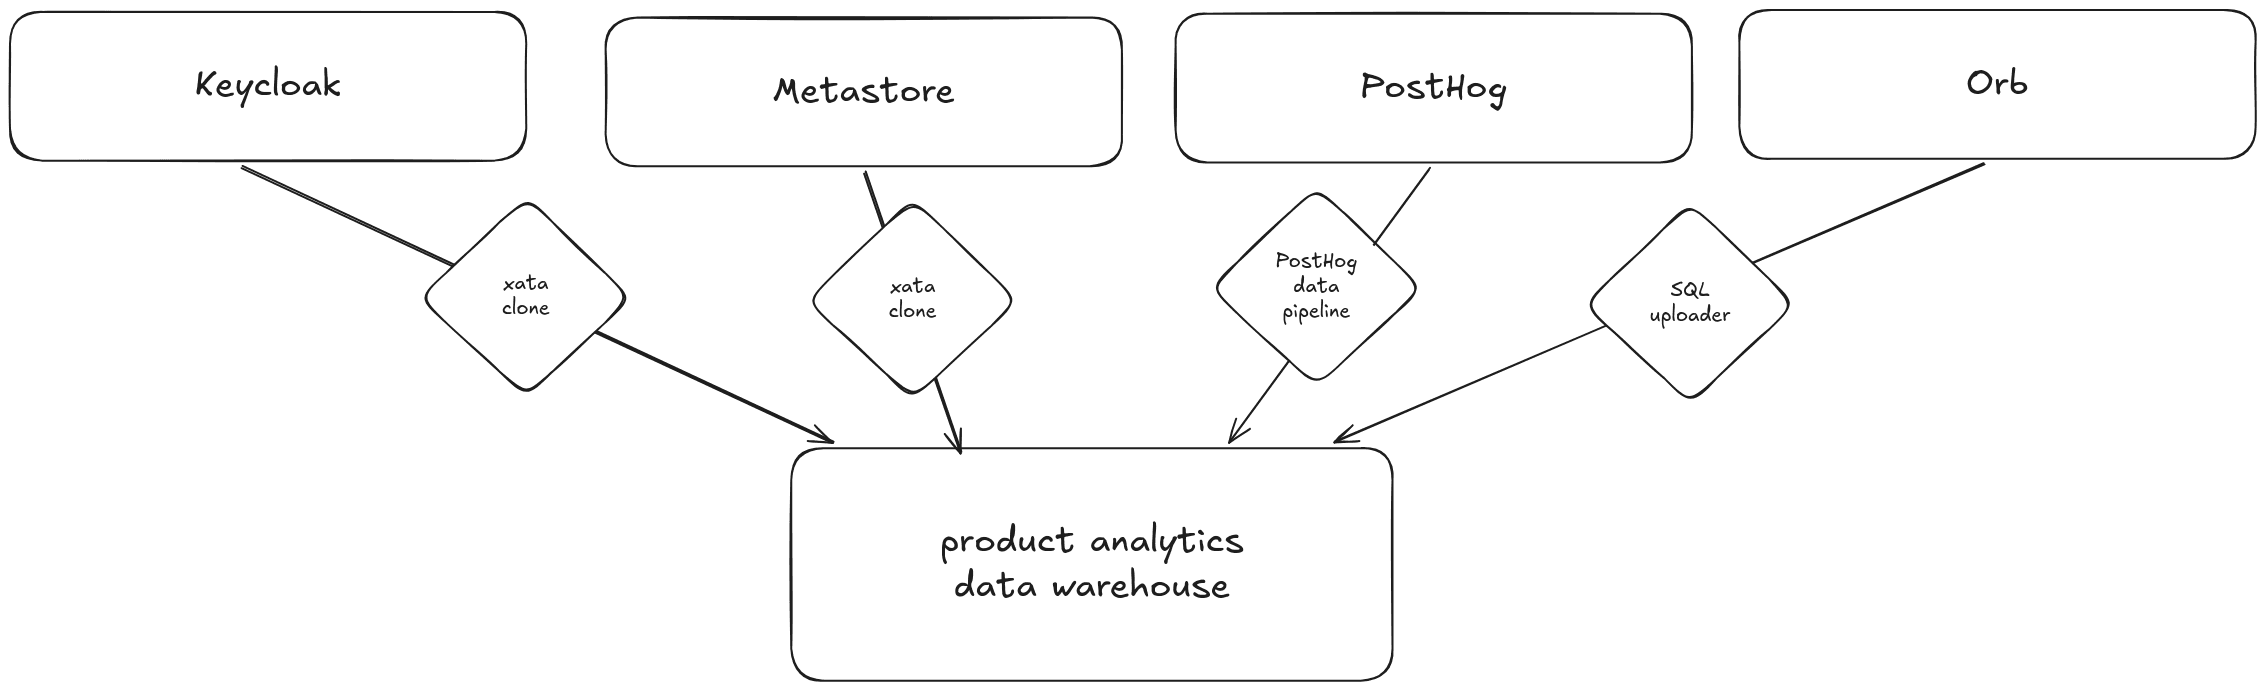
We had all the data we need. We had user identities in Keycloak, product usage in our core database called the metastore, billing records in Orb, and behavioral events in PostHog. Our problem was that data was scattered across four systems with no way to join them. We could not answer basic questions like "which trial users created the most branches last week?" without manually cross-referencing multiple databases.
We decided to centralize this information into a single, structured system that can power analytics and feed into tools like our CRM. Now we can make data-driven decisions about growth, retention, and customer success.
This post walks through how we did it: the ingestion pipelines, the materialized views that flatten PostHog events, the pg_cron schedules that keep everything fresh, and the copy-on-write branches we used to iterate on schema design without risking the live warehouse.
Why analytics run outside production?
Running analytics directly against transactional systems is inefficient. It can even degrade performance. We cannot slow down branch creation because someone is running an analytics query. We need a database optimized for running queries that answer questions like “How many active branches were created per organization in the last 30 days?”
Our product databases are transactional systems. These systems are designed to handle real-time operations: creating users, projects and branches, processing billing events, and responding to API requests. These are known as OLTP systems (Online Transaction Processing).
This data must be moved to a separate database to a data warehouse.
A data warehouse is a centralized data store that collects and consolidates data from multiple sources. Instead of focusing on running day-to-day application operations, it is designed specifically for reporting, analytics, and business intelligence.
Key characteristics of a data warehouse:
- It pulls data from different systems (application databases, billing providers, internal tools).
- It stores data in a structured format optimized for querying and analysis.
- It supports complex aggregations and historical analysis.
- It separates analytical workloads from production workloads.
Why use Postgres?
As I mentioned in the introduction it was a simple choice for us. We’re fully aware that Postgres was not originally designed to be a data warehouse. At its core, it’s an OLTP database. But that doesn’t mean it’s limited to those use cases.
Postgres is an incredibly flexible system. With the right schema design, indexing strategy, and configuration, it can handle analytical workloads surprisingly well, especially at small to medium scale. For our current data volume and reporting needs, it strikes the right balance between simplicity, performance, and operational overhead.
Could we adopt a dedicated OLAP engine in the future? Yes. And we likely will when our data size, query complexity, or concurrency demands justify it. At the moment, Postgres gives us minimal operational complexity, tight integration with out existing stack and enough performance headroom for analytics.
Instead of optimizing for scale we don’t yet have, we chose to move fast, learn, and build with the tools already know. When the company and user base grow to the point where Postgres becomes a bottleneck for analytics, we’ll evolve the architecture. Until then, it’s the right tool for the stage we’re in.
Four data sources, one data warehouse
Most of the signals we care about already exist inside our transactional systems. They just live in different places, each optimized for running the product.
1. Authentication database
We use Keycloak for authenticating and managing users. Its Postgres database contains the core identity layer of our users:
- User names
- Email addresses
- Organization memberships
- Trial expiration
This data answers foundational questions like:
- Who is using the product?
- How are users grouped into organizations?
- Has the trial period ended?
2. Metastore, the product database
This is where the operational product data lives. This is behavioral data at the infrastructure level:
- Projects
- Branches
- Deployment regions
- Instance sizes
- Scale-to-zero configurations
From this dataset, we can start analyzing adoption patterns:
- How many branches users create in their projects?
- Which instance sizes are most popular?
- Are users enabling scale-to-zero?
3. Billing system
Revenue data is essential if product analytics is meant to drive business outcomes. From the billing system, we collect:
- Billing status
- Invoices
This allows us to connect product usage with monetization:
- Which behaviors correlate with upgrades?
- What usage patterns precede churn?
- How does feature adoption map to revenue?
4. Product event data
Finally, we ingest product event data from PostHog. PostHog is a product analytics platform that captures user-generated events inside the application. Unlike structural database records, event data captures user behavior in real time. It tells us not just what exists in the system, but how and when users interact with it.
We collect events like project creation, project deletion, branch creation, and branch deletion. Here is what a raw PostHog event looks like when it lands in our warehouse:
The properties field is a JSONB blob. It is flexible for ingestion, but inefficient for repeated analytical queries. We solve this with materialized views (covered below).
This tells us the usage patterns:
- What was the most popular Postgres image type in the last 30 days?
- Who created and deleted branches within 24 hours?
Data centralization pays off
None of this is possible when the data lives in four separate systems.
- We can find contact information for each database branch.
- We can detect when someone creates a manual backup and send them targeted onboarding guidance about automated backup management.
- We can find contact information for every database branch in case we need to notify users about maintenance or clean up storage for expired trials.
From source to warehouse
Now that we know what data to collect and, it is time to think about how to ship the records to the database. In this section I am going through the 3 methods we use to onboard the data.
But first let’s talk about where how the data is going to be captured in the database. We have 3 sources: PostHog, internal product and Orb, our billing provider. The data from these sources land in their dedicated schemas. PostHog tables are created in the schema posthog, and only the posthog_exporter role has write and create access on this schema. Product databases are captured in the schema public using their dedicated roles _exporter. Finally, billing data from Orb is stored in the schema orb and the only role that can write it is orb_exporter.
Piping PostHog events into Postgres
PostHog provides data pipelines to analytics events from their data store. We simply created two new pipelines: one for persons and one for events. These pipelines are executed once a day and the records land in the dedicated posthog schema in our product analytics warehouse.
Controlled cloning of internal databases using xata clone
To bring product and user data into the warehouse, we used xata clone to create scheduled database clones.
The source Postgres clusters run inside Kubernetes, managed through our Xata infrastructure. We automated snapshotting and ingestion using two Kubernetes cron jobs that run nightly. Before adding the jobs, we created a minimal container image for the xata CLI. You can learn more about the features and use cases for the container image in this post.
Cloning the product database was straightforward, we could mirror all of the tables into the data warehouse. However, with user data we had to be careful not to copy passwords, hashes or anything that could compromise our service. Keycloak uses ~70 tables to store its internal information. We managed to filter it down to 6 tables that contained relevant and safe data. Thus, using the filter-tables flag, we only clone 6 tables.
Right now, daily syncs are enough for our scale. As the company grows, we can increase the frequency: hourly, every 10 minutes, or even near real-time. The key is flexibility without unnecessary complexity. Furthermore, we added a simple dashboard and alerts in SigNoz to make sure the cron jobs run every night as expected.
Batch uploader for billing information
To ship data from our production services, we created a reusable SQL client that has two responsibilities. First, it ensures that the target schema is available and the proper tables with the column types are created. The second responsibility is to upload the data in batches to the data warehouse.
For now we use this to get billing information and invoices from Orb using their API. We added rate-limiting to the Orb client implementation to not to go over the API limits of Orb.
This also runs as a Kubernetes cron job every night. We monitor this job the same way as explained above.
Optimizing data for analytics
Collecting data is only half the job. To make writing analytics queries simpler, we have to normalize data. Event payloads, especially from product analytics tools, tend to be flexible and JSON-heavy. That flexibility is powerful for ingestion, but inefficient for repeated analytical queries.
Flattening JSONB event data with materialized views
From PostHog, we receive event properties in a jsonb format. This allows events to carry arbitrary properties, but querying deeply nested JSON fields repeatedly is slow and messy.
To solve this, we created a flattened representation tailored for analytics queries for every user events. We used materialized views for that purpose. A materialized view works like a regular view, but instead of recalculating results every time, it stores the computed result set on disk. That gives use faster and cleaner analytical queries.
An example materialized view definition for branch creation events:
This gives us a view suitable for querying branch creation events:
Automating materialized view refreshes using pg_cron
However, materialized views must be refreshed when the underlying tables change. In Postgres, this is done with:
Because we’re running on Xata’s Postgres service, we can use the pg_cron extension. Xata supports pg_cron out of the box, which allows us to schedule database jobs, after enabling the extension on the UI, without external schedulers or additional infrastructure.
To setup a daily refresh of the materialized view, I ran the following SQL statement:
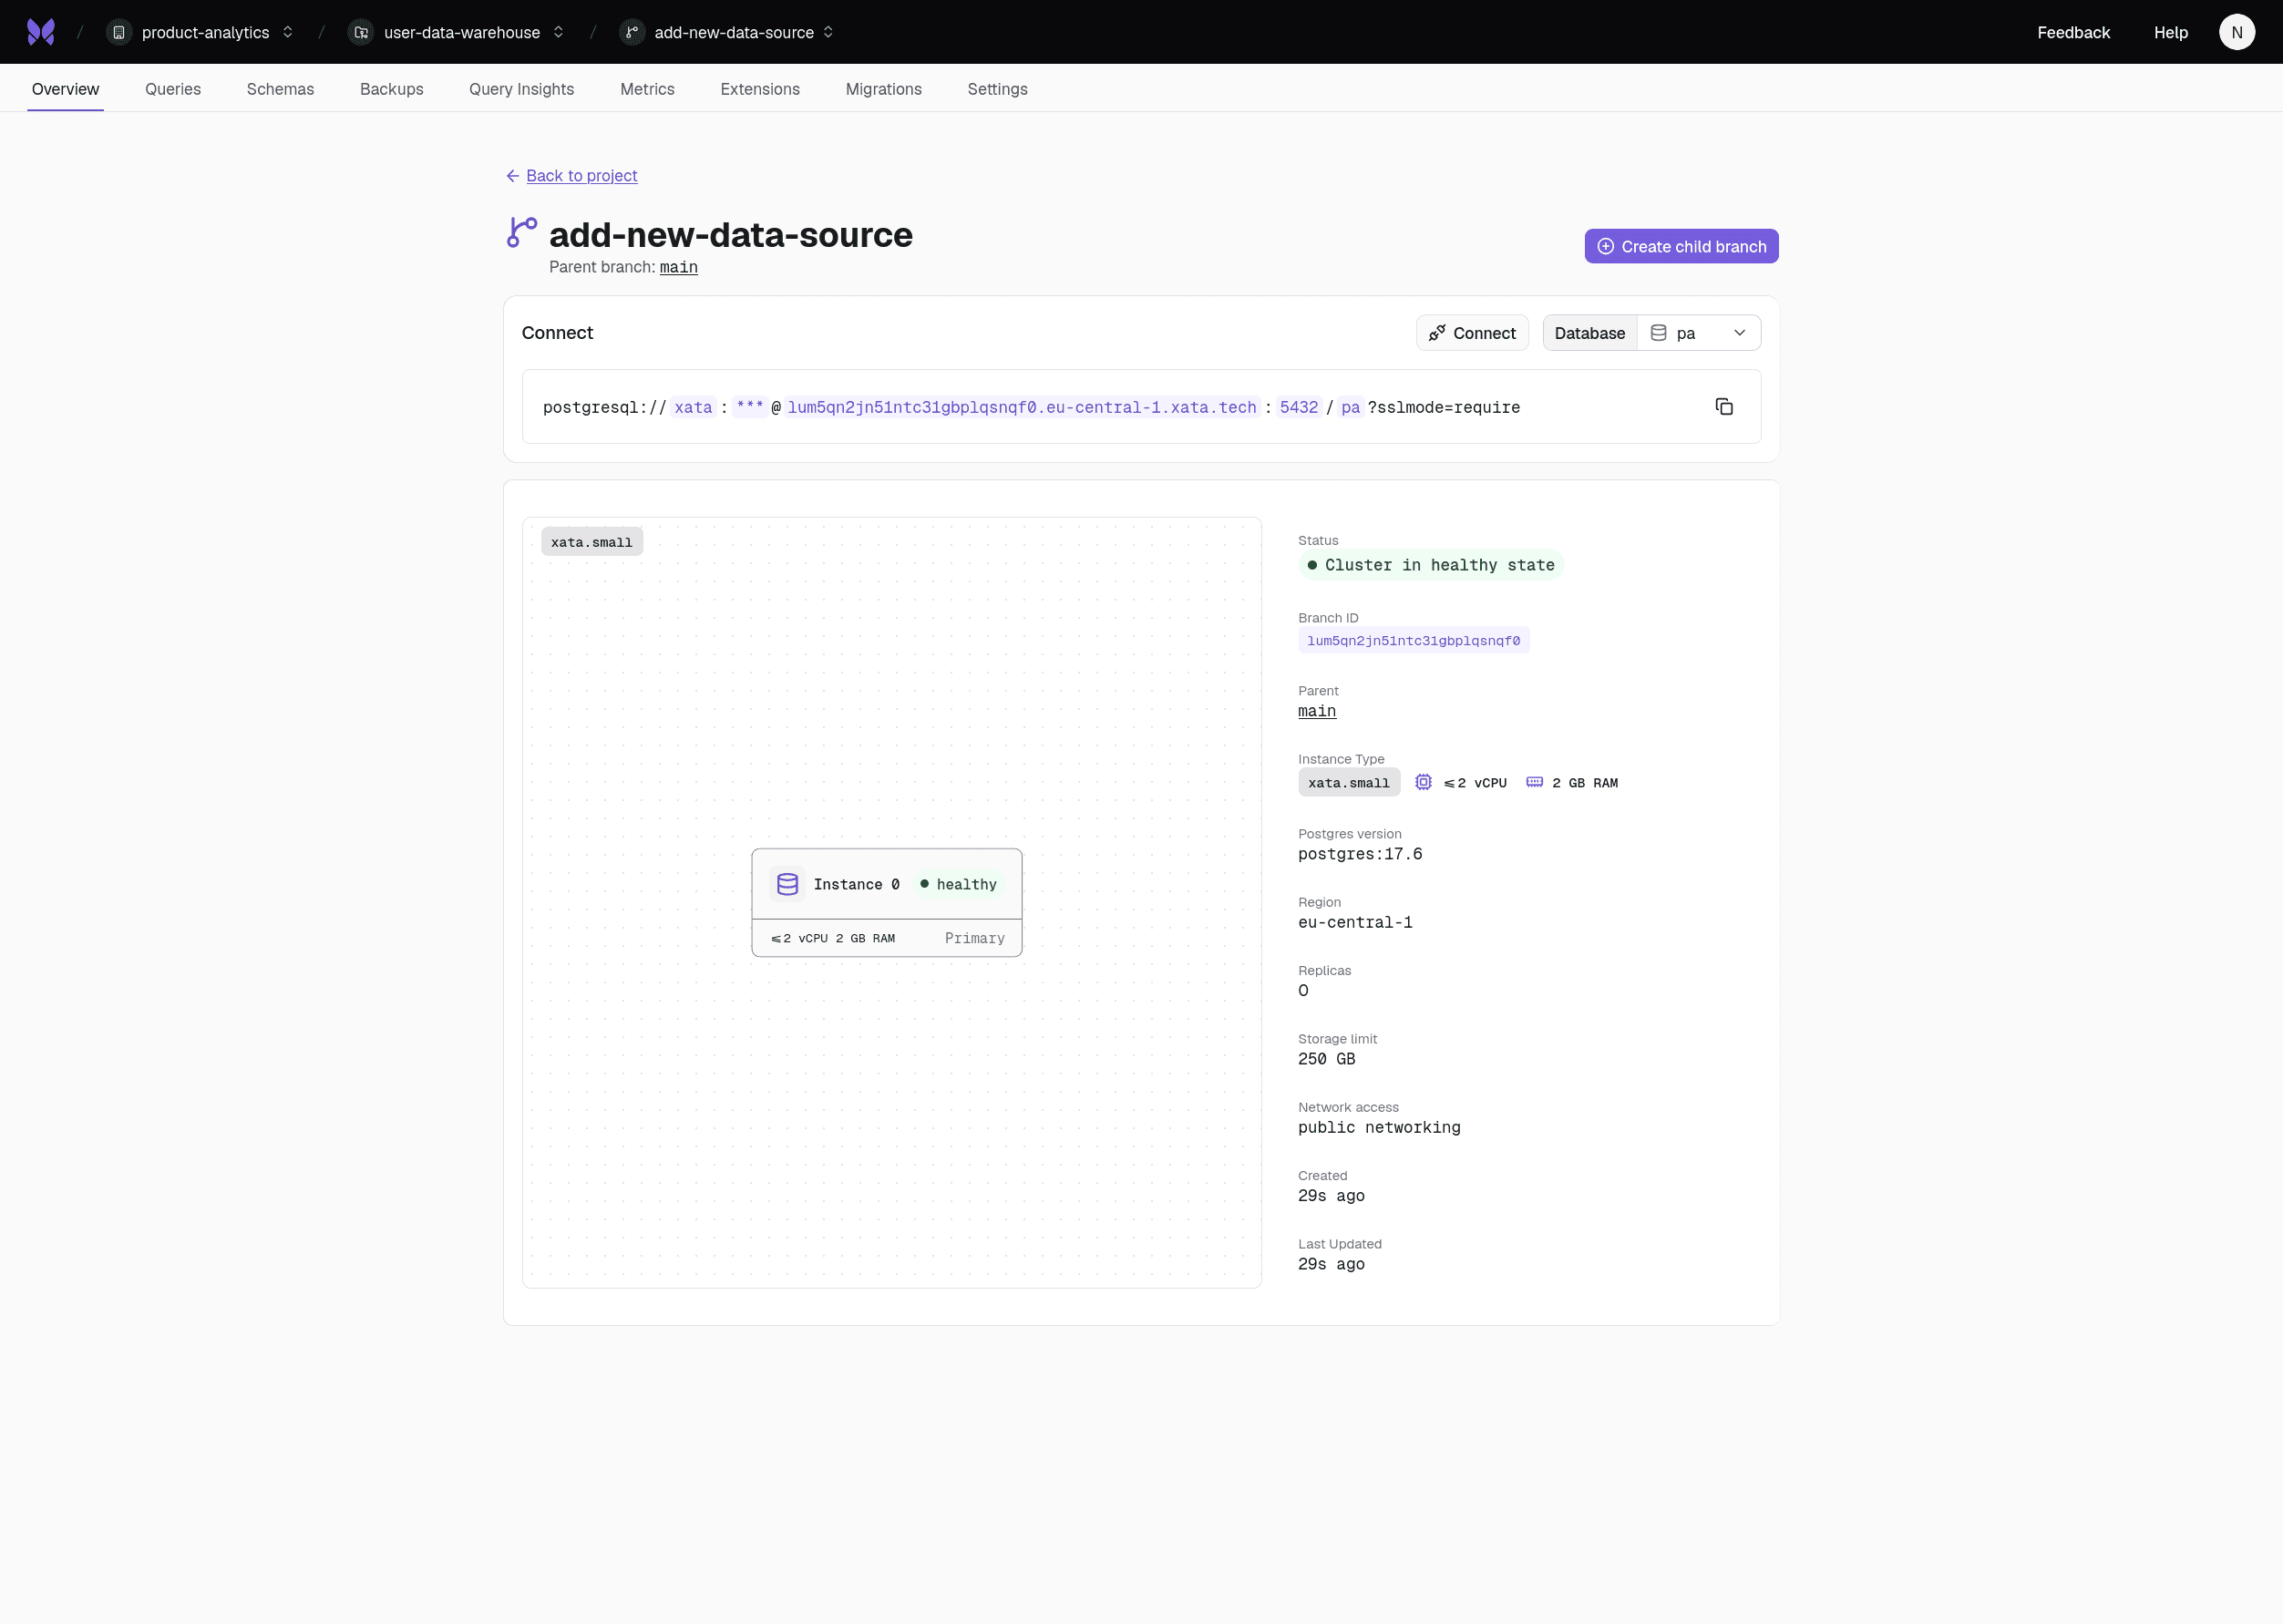
Safe iteration with branches
After normalizing PostHog data, the next step was ingesting internal product and user identity data. Instead of modifying the live analytics database, we created a dedicated developer branch. This allowed us to iterate on schema design, transformations, and refresh strategies safely.
Branches gave us:
- Isolation from production
- The freedom to test boldly
- The ability to validate assumptions before rollout
That safety layer dramatically reduces risk and speeds up development.
The upgrade path: pg_duckdb
If you already use an analytics database like DuckDB, you can integrate it directly with Xata using the built-in pg_duckdb extension.
When the execution of our analytics queries decline, we can rely on pg_duckdb to improve performance with running the following statement:
Furthermore, this extension allows Postgres to connect to and query a DuckDB instance as if it were part of the same database environment. In practice, this means you can run your normal SQL queries in Postgres while seamlessly accessing data stored in DuckDB. It gives you the flexibility to combine operational data from Postgres with analytical datasets from DuckDB in a single query.
As our analytics needs grow, this approach gives us a natural upgrade path. We can keep Postgres as the central warehouse while offloading heavier analytical workloads to DuckDB when needed, or exporting our data common data lake formats like Apache Iceberg.
Conclusion
Building a product analytics warehouse doesn’t always require a complex stack or a dedicated OLAP platform from day one. For us, the most important step was simply bringing our data together in one place.
By centralizing identity data, product usage, billing information, and event streams into a Postgres warehouse, we created a foundation that allows us to understand how people actually use our product. Instead of looking at isolated systems, we can now connect user behavior, infrastructure usage, and revenue signals in a single environment.
The architecture is intentionally simple:
- Postgres as the warehouse
- Scheduled pipelines to ingest data
- Materialized views to normalize event data refreshed periodically using
pg_cron - Safe experimentation through database branches
This setup gives us immediate analytical value while keeping operational overhead low. More importantly, it lets us iterate quickly. As our dataset grows and our analytical needs evolve, we can gradually introduce more specialized tools or OLAP engines. Postgres does not lock us in. It is a practical starting point.
Give every agentic workload its own Postgres branch
Create instant database clones with production-like data for every agent, workflow, and CI/CD pipeline.
Related Posts
Is Postgres really enough in 2026?
Ship faster with Postgres: JSONB, full-text search, trigrams, and cache tables. Add Redis or Elasticsearch only after you measure real production bottlenecks.
Modernize your database workflows without a migration (code with real data)
Modernize dev workflows: replace your shared, fragile staging database with instant branches for your Postgres database.
Zero Downtime Schema Changes with Vercel and Xata
Discover how Xata’s pgroll‑powered platform plus Vercel preview deployments enable zero‑downtime Postgres schema changes with instant branches.
Going down the rabbit hole of Postgres 18 features
PostgreSQL 18 brings async I/O (2-3x faster sequential scans), native UUIDv7, OAuth 2.0, virtual generated columns, and stats that survive upgrades.