Reaction to the PlanetScale PostgreSQL benchmarks
Our reaction to the PostgreSQL benchmarks published by PlanetScale and the results of running them against a Xata instance.
By:
Tudor GolubencoPublished:
Reading time:
9 min readA couple of weeks ago, with the announcement of their PostgreSQL private beta, PlanetScale published a series of benchmarking blog posts comparing their “Metal” offering with several other Postgres service providers. We were curious how our new Xata platform (also in private beta) would perform on those benchmarks, so we ran them ourselves. While doing so, we took notes on the methodology, results, and conclusions, which we share in this blog post.
This post includes some constructive criticism of the benchmarking methodology, along with a discussion on local versus network storage for running high-performance PostgreSQL. We’ll show that a Xata PostgreSQL setup, which separates storage from compute using NVMe over Fabrics, can offer very high performance at a low cost, while still providing the flexibility of the decoupled architecture and extra features like fast copy-on-write branching.
Benchmarks - reproducibility and openness
When I saw the series of comparative benchmarking blog posts from PlanetScale, I was intrigued. My default reaction to database benchmarks is usually one of skepticism. It’s very easy to cherry-pick use cases, hardware setups, and configurations to paint whatever picture you want.
That said, I do believe benchmarks can be a net-positive and foster healthy competition between players. For example, I love ClickBench for OLAP databases and ann-benchmarks for vector search implementations. I enjoy checking these regularly because it’s fun to see competitors one-up each other on a common set of benchmarks.
I particularly appreciate that, for example, ClickHouse is currently not at the top of ClickBench (only fifth on the list right now), which is a sign that it’s a fair playing field. We all understand that raw performance is only one of the many factors that customers consider, and that other aspects often matter more.
Importantly, those projects come with GitHub repositories containing clear instructions for running the tests, an easy way to download raw results, and guidelines on how to contribute your own results.
This is what I was hoping for, but the PlanetScale benchmarks are not that, and I don’t think they intend that, or at least not yet. There is no repo with automation and the raw results, just brief instructions for running sysbench.
To their credit, the PlanetScale team has provided an email address for benchmarks-related questions. I reached out, and they promptly answered with the requested clarifications and provided the raw results as JSON. That saved us a lot of time when running our own tests.
Benchmarks - relevancy and use-case coverage
The PlanetScale benchmarks use three types of tests:
- A “TPCC like” benchmark, implemented as a sysbench script by Percona.
- An “OLTP read-only” benchmark, also provided by sysbench.
- A test that just does
select 1;200 times in order to measure latency.
TPCC, the main test highlighted in PlanetScale’s summary post (and the one we also used above), is a classic OLTP benchmark and a reasonable choice for measuring transactional performance. If you're trying to determine whether it reflects your use case, more than likely it doesn't. Keep the following in mind:
The use case that it simulates is somewhat outdated (it’s from 1992 after all), a whole-sale provider that sales inventory from warehouses. It is very write heavy (~88% of the transactions are doing writes). It uses many multi-step transactions, meaning multiple reads and writes in the same database transaction.
More importantly, a single fixed scale factor was used: 250. This means a DB size of around 500GB, and the creation of that database is not included in the test. TPCC, as specified, is supposed to be an open-loop benchmark where the scale-factor is progressively increased. That simulates better what happens in a real scenario when the data grows over time. The sysbench readme does note this important caveat.
The “OLTP read-only” benchmark is also fixed size. It creates 10 tables with 130 million rows each, then runs mostly random indexed queries on them. This is good at forcing Postgres to go to the disk as much as possible, showing the differences in storage implementations. However, when it comes to how relevant it is to real-world use cases, again, it’s quite debatable.
Benchmarks - methodology
We’re now getting into the details of how the tests were executed. And, as we all know, that’s where the devil is.
After playing with the tests for myself, I suspect two things might have caused sub-optimal results for a few of the tested services (however I didn’t verify this directly, I’m sure engineers from those services will try).
First, from what I understand, the procedure was that the dataset was loaded, and then more or less immediately, the benchmark was executed. Since the benchmark runs for only 5 minutes, it’s possible that PostgreSQL was still performing background activities like checkpointing or vacuuming from the initial data load. Also, the TPC-C benchmark does a lot of updates in a run, so after a few runs, the database might be relatively bloated which can affect the performance.
These issues can be mitigated by running CHECKPOINT; and VACUUM; before each test run.
Secondly, there hasn’t been any attempt to tune the Postgres configuration:
All Postgres configuration options are left at each platform's defaults. The one exception to this is modifications to connection limits and timeouts, which may be modified to facilitate benchmarking.
In practice, this means that even if the server has 32 GB of RAM, due to sub-optimal configuration PostgreSQL might only use 2–3 GB. Or if the server has 4 or 8 CPUs, the benchmark might only utilize 1 or 2 of them.
One could argue that it’s up to service providers to optimize their default configurations based on instance size, and that’s a fair point. However, tuning PostgreSQL effectively requires knowing both the instance size and the workload. And as discussed in the previous section, while TPCC is a classic OLTP benchmark, it’s not representative of most workloads in production today. So providers may have optimized their defaults for other scenarios.
Would it have been fairer to use the exact same PostgreSQL config for all services? That’s also questionable, because depending on the storage layer (local vs. network, SSD vs. NVMe, etc.), the optimal configuration will differ.
So what would be fair then? IMO best would be to set some ground rules, for example no config changes that impact durability (e.g. fsync or synchronous_commit shouldn’t be allowed). Beyond that, let providers tune their setups as they see fit. As long as everyone publishes their configuration and the results are reproducible, that would create a level playing field.
Benchmarks - what the numbers don’t show
There are some things that won’t show in the benchmarks, but are important to understand when interpreting their results. In the case of PlanetScale Metal, there are tradeoffs in terms of the flexibility that you get. Consider this FAQ:
Since storage doesn't autoscale, what happens if I max out my storage?
With traditional network-attached drives, you can continue adding as much data as needed and we will autoscale your storage. This isn't true with Metal - you have to select a set amount of storage upfront and must choose a larger instance if more space is needed.
If you run out of storage or get very close to running out, we will switch your database into read-only mode to prevent a full outage. Your database will no longer accept writes. This is an emergency situation that we want to make sure you avoid. […] Because we have to migrate your data to the new drive, this is not an immediate operation. Fortunately, there is no downtime or impact to service while your data is migrated. Because it takes some time to migrate, we recommend upgrading storage size far before running out of storage.
In practice, this means you will have to over-provision the disks by a fair amount, because you don’t want to run close to having the DB in read-only mode (that can result in hours of downtime). And the available disk sizes are tied to instances sizes, so you might need to upgrade the instance size even if you really only need more disk.
Xata storage solution and results
In the setup that we have tested, using a xata.2xlarge instance, we are using network attached storage, but using a very fast NVMe over Fabrics implementation based on Intel SPDK. This setup can reach IOPS in the range of millions (see the detailed performance reports), rivaling local NVMe drives.
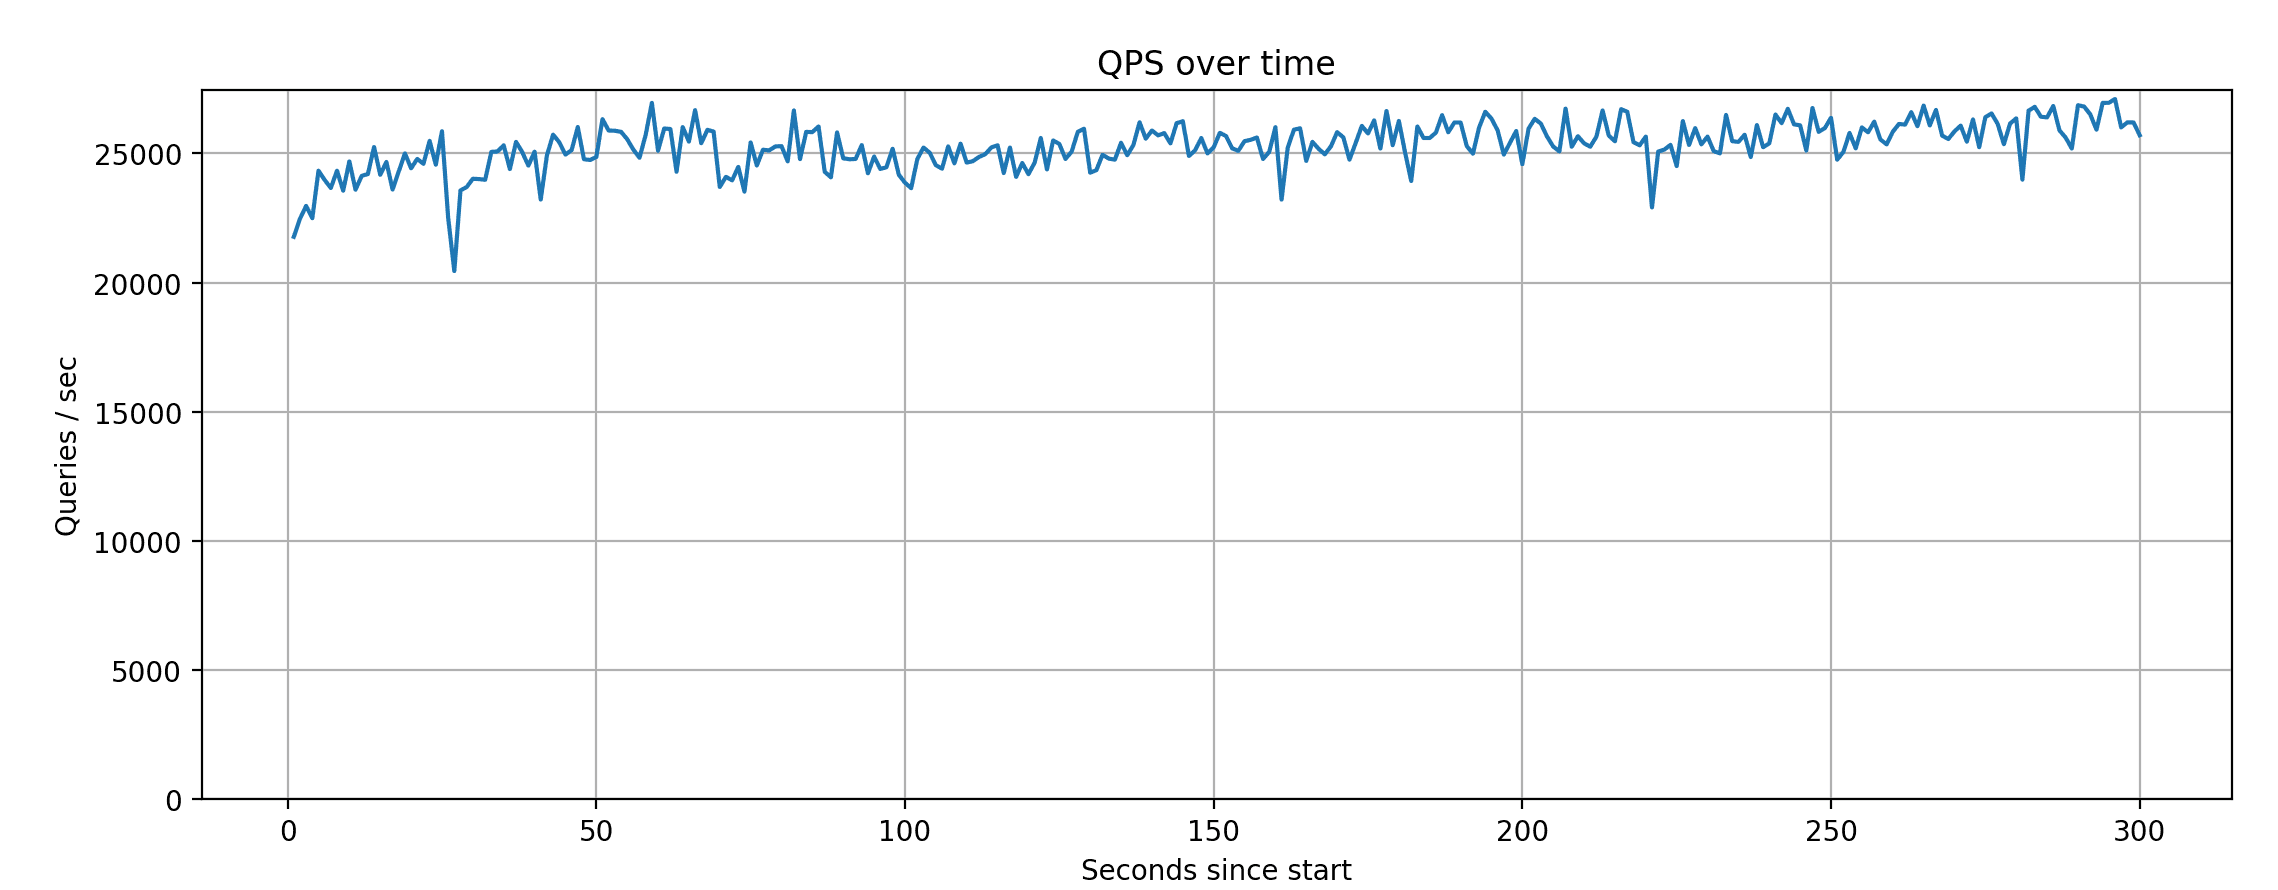
In this setup, Xata achieves around 25K QPS on average on the TPCC test with 64 connections.
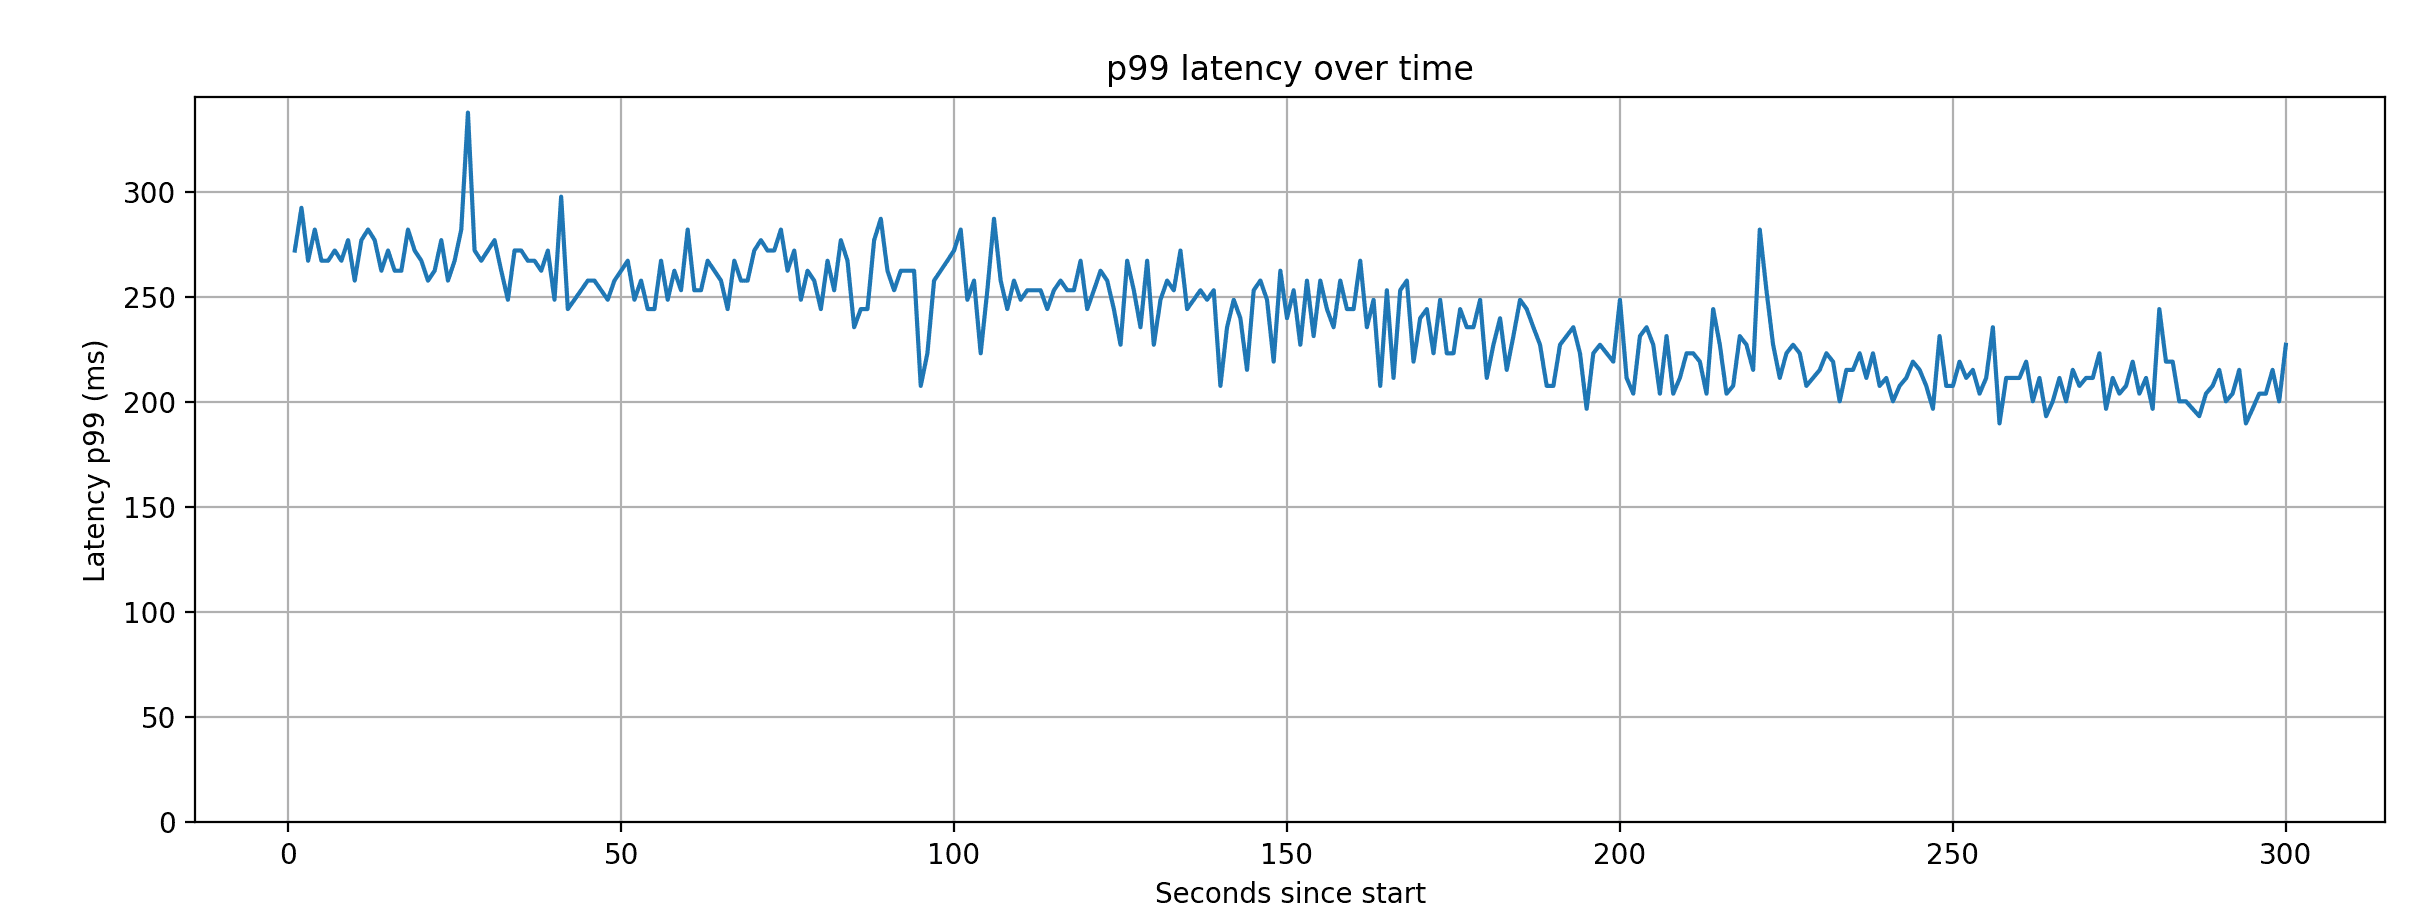
The P99 latency, as measured during this test run, averages around 250ms, which is on par with the best results from the tests.
The SPDK-based storage explains how we can achieve very high IOPS and therefore similar to performance local NVMe disks. But how come we’ve actually got a better results? There are two reasons:
First, we tuned the PostgreSQL configuration to match the benchmark and the instance resources, as discussed above. This has made the bottleneck be the CPU, not the storage.
Secondly, the xata.2xlarge has 8 CPUs while the M-320 only 4. This is because we are using the 1:4 ratio, instead of the memory-optimized 1:8 ratio. We chose this to align with the original test setups used for Neon, Supabase, and TigerData, which also ran on 8-core instances. We also thought this is fair because the xata.2xlarge cost is roughly equivalent to the M-320 (more on that below).
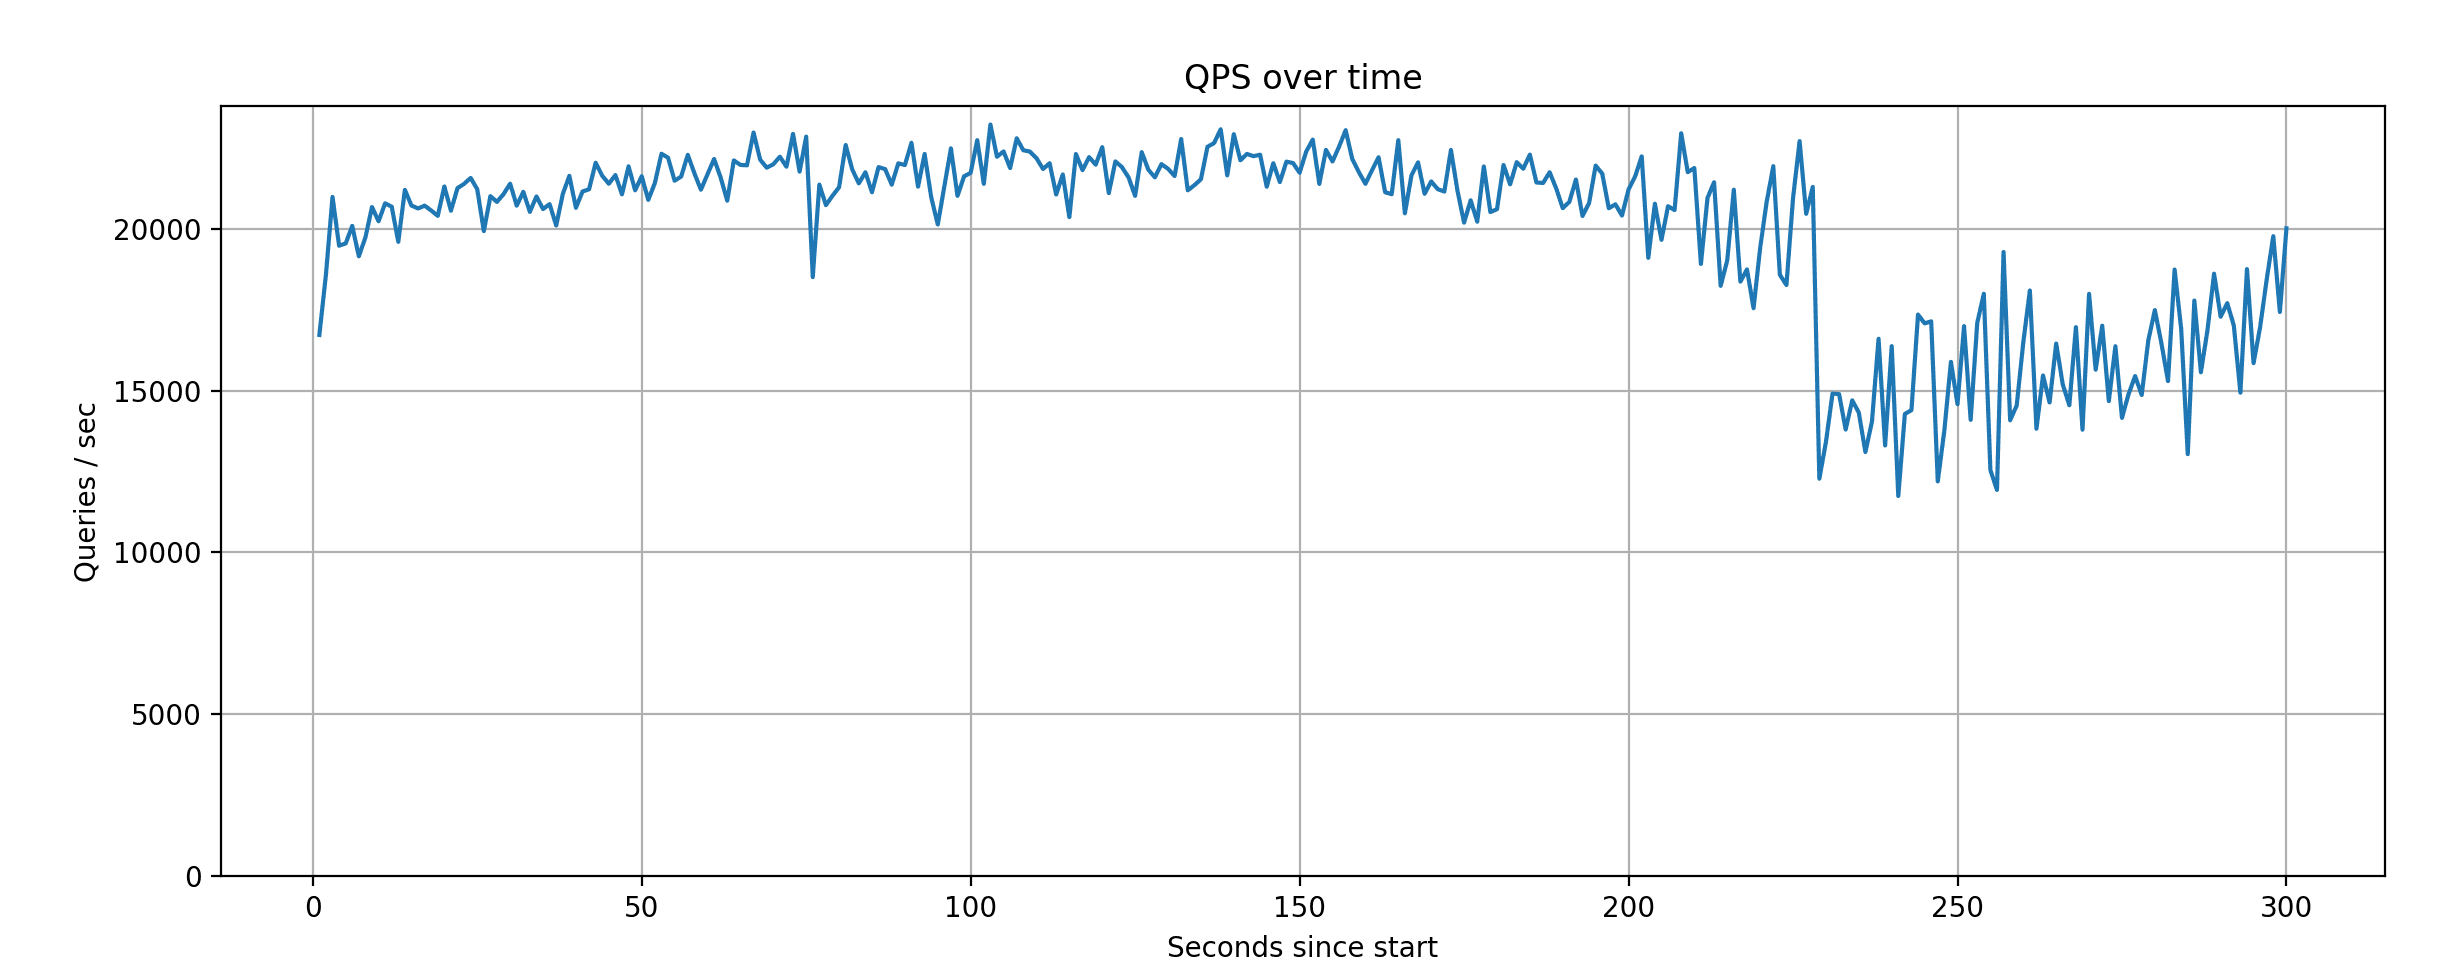
However, after achieving ~25K QPS in the test, we were curious to see how a custom Xata instance restricted to 4 CPUs would do. We tried a bit of configuration tuning, but it turns out the Postgres defaults with a small shared_buffers work well in this case. With this configuration we achieved around 20K QPS on average.
The raw results for these runs can be found, together with the configuration parameters, can be found in this repository.
In our own tests, we have only measured the Xata service. We will try to reproduce other results in future work, using similar Postgres configuration like we do. With this caveat, if we put together the results measured by PlanetScale with the results for xata.2xlarge we get the following graph:
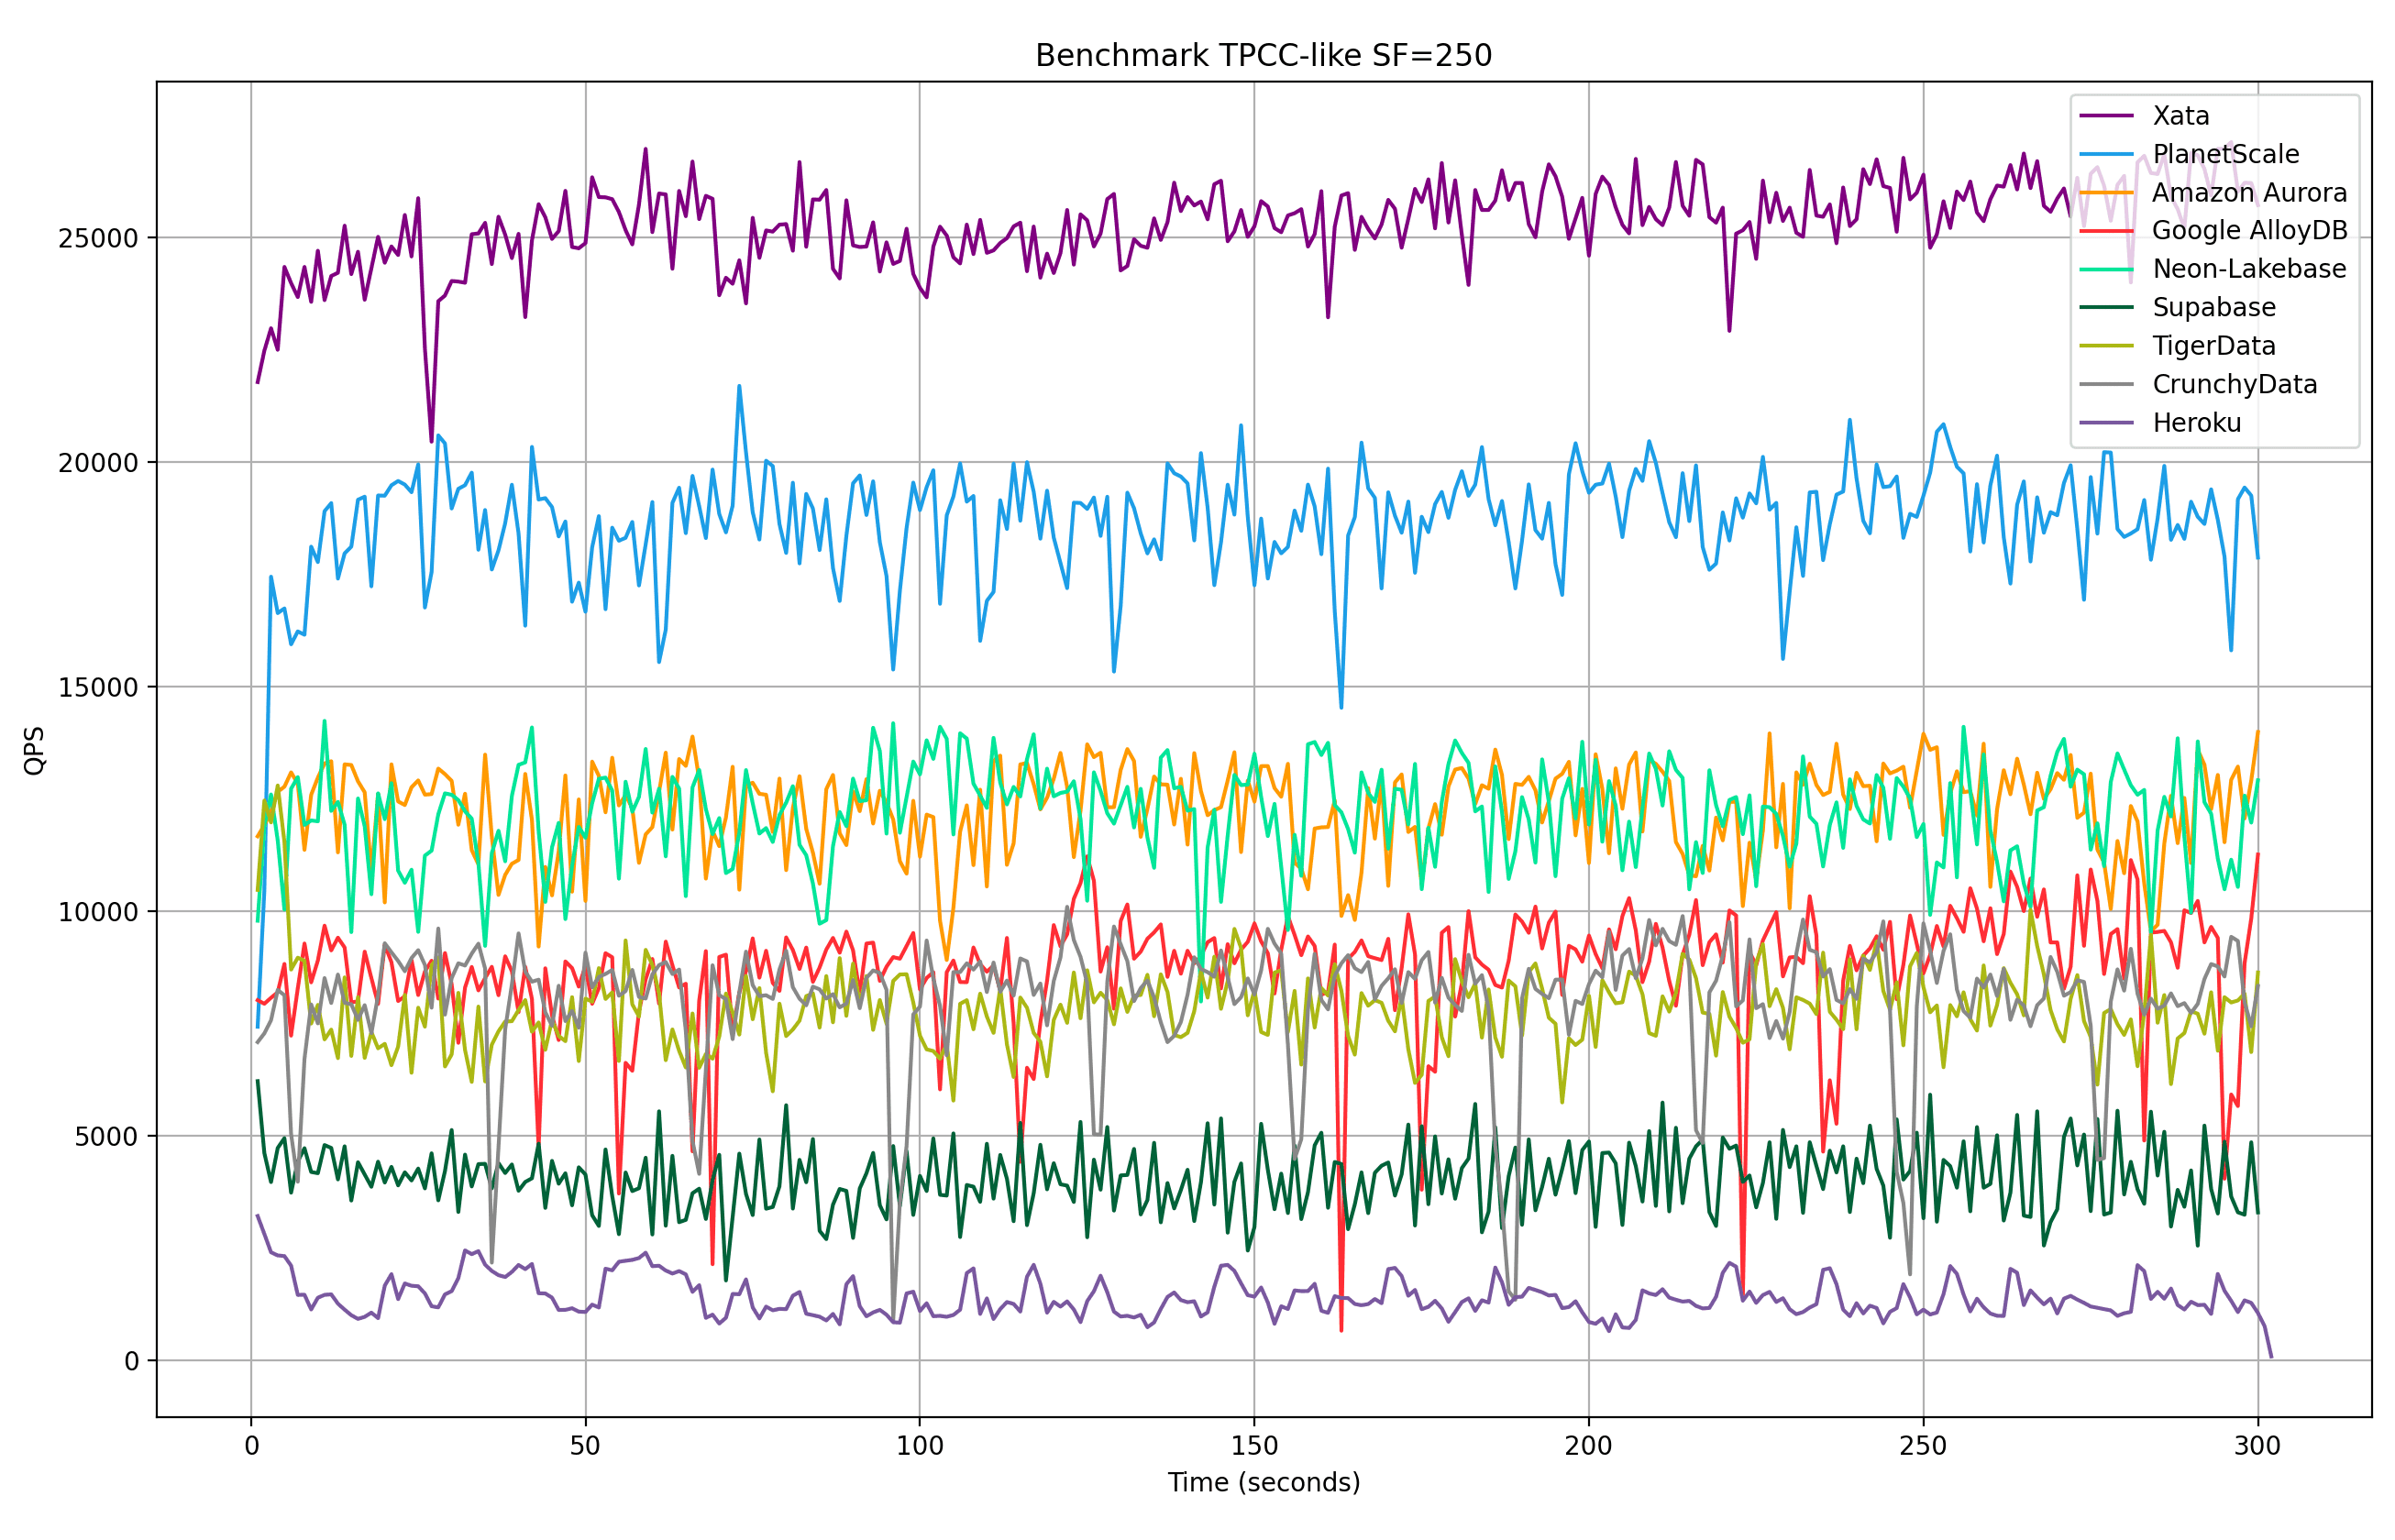
The above is not an apples-to-apples comparison, because the Postgres configuration is different between services. We are presenting it to demonstrate that even during heavy benchmarking, network attached storage can be fast enough. In the tests runs above, especially the one limited to 4 CPUs, the bottleneck is the CPU, not IOPS.
Cost wise, a xata.2xlarge is $280 per month. Multiplying with 3 to have two replicas, that’s $840 for compute. On the storage side, we are currently using the Postgres replication so we keep multiple copies of the data. On the other had, with Xata you only pay for the storage that you actually use. So that is: 500 x 0.30 x 3 = $450 per month. This brings the total to $1290, which is just a bit under the M-320 cost.
Conclusions
It was fun running through these benchmarks, and I am grateful for PlanetScale’s work on testing all the providers (this is time consuming for sure). I don’t think they are perfect, but I do think they could become an open fair-playing field that would be a win for competition. I also see that these benchmarks have started to be used in blog posts from Oriole and Neon.
We at Xata would be happy to contribute to a joint/neutral effort in benchmarking. We have already open-sourced pgdistbench, our tooling for stress tests and benchmarking.
After running the benchmarks, my own convictions are:
- Using cloud servers with local NVMe drives is indeed unlocking the best performance on the hyper-scalers.
- However this doesn’t necessarily means strictly coupling them to the compute. The SPDK framework is incredibly fast at connecting the compute and storage clusters.
One of the key aspects we optimized the new Xata PostgreSQL platform is deployment flexibility. This allows us to experiment with different compute/storage configurations and provide the best possible setup for when it matters, in your environment or ours.
Performance and benchmarks should not be the only thing you should be looking at when choosing your Postgres providers, and I feel good about the Xata feature set (copy-on-write branching, anonymization, zero-downtime schema changes, scale-to-zero, etc.) and our history in reliability.
Request access to our private beta.
Give every agentic workload its own Postgres branch
Create instant database clones with production-like data for every agent, workflow, and CI/CD pipeline.
Related Posts
Neon vs Supabase vs Xata: Postgres Branching Compared
Compare how Neon, Supabase, and Xata handle Postgres branching. Covers copy-on-write vs schema-only approaches, with architecture diagrams.
PostgreSQL Branching: Xata vs. Neon vs. Supabase - Part 2
Take a closer look at PostgreSQL branching by comparing Xata, Neon, and Supabase on architecture, features, and real-world costs.
Xata: Postgres with data branching and PII anonymization
Relaunching Xata as "Postgres at scale". A Postgres platform with Copy-on-Write branching, data masking, and separation of storage from compute.